Forex trading is one of the most popular and lucrative ways to make money online. However, it requires a deep understanding of the market and its trends. One of the most important aspects of Forex trading is predicting the next candlestick. In this article, we will explore how to predict the next candlestick in Forex trading.
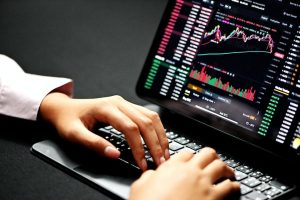
Candlestick charts are one of the most popular tools used in Forex trading. They provide a visual representation of the market and help traders identify trends and patterns. A candlestick chart consists of individual candles that represent a specific time period, such as one hour or one day. Each candlestick has a body and two wicks, one on each end. The body represents the opening and closing price of the time period, while the wicks represent the highest and lowest price during that time period.
To predict the next candlestick, traders need to analyze the current market conditions and identify potential trends or patterns. There are several ways to do this, including technical analysis, fundamental analysis, and price action analysis.
Technical analysis is a method of analyzing the market based on historical data and price charts. Traders use technical indicators, such as moving averages, support and resistance levels, and trend lines, to identify potential trends and entry and exit points. Technical analysis can be used to predict the next candlestick by identifying patterns in the chart and predicting where the price is likely to move next.
Fundamental analysis is a method of analyzing the market based on economic and political events that may affect the value of a currency. Traders use news releases, economic data, and geopolitical events to predict market movements. For example, if there is a positive economic report, such as a strong jobs report, traders may predict that the currency will strengthen and the next candlestick will be bullish.
Price action analysis is a method of analyzing the market based on the behavior of price itself. Traders use price patterns, such as double tops and bottoms, head and shoulders, and triangles, to predict market movements. Price action analysis can be used to predict the next candlestick by identifying patterns in the chart and predicting where the price is likely to move next.
In addition to these methods, traders can also use candlestick patterns to predict the next candlestick. Candlestick patterns are specific formations that occur in the chart and provide insight into the market sentiment. There are several types of candlestick patterns, including bullish and bearish reversal patterns, continuation patterns, and indecision patterns.
Bullish reversal patterns indicate that the market is likely to reverse from a bearish trend to a bullish trend. Examples of bullish reversal patterns include the hammer, the bullish engulfing pattern, and the morning star. Traders can predict the next candlestick will be bullish if they see one of these patterns in the chart.
Bearish reversal patterns indicate that the market is likely to reverse from a bullish trend to a bearish trend. Examples of bearish reversal patterns include the shooting star, the bearish engulfing pattern, and the evening star. Traders can predict the next candlestick will be bearish if they see one of these patterns in the chart.
Continuation patterns indicate that the market is likely to continue in the same direction as the previous trend. Examples of continuation patterns include the flag, the pennant, and the triangle. Traders can predict the next candlestick will be in the same direction as the previous trend if they see one of these patterns in the chart.
Indecision patterns indicate that the market is uncertain about its direction. Examples of indecision patterns include the doji, the spinning top, and the inside bar. Traders can predict the next candlestick will be unpredictable if they see one of these patterns in the chart.
In conclusion, predicting the next candlestick in Forex trading requires a deep understanding of the market and its trends. Traders can use technical analysis, fundamental analysis, price action analysis, and candlestick patterns to identify potential trends and patterns. By analyzing the current market conditions, traders can predict the next candlestick and make informed trading decisions.