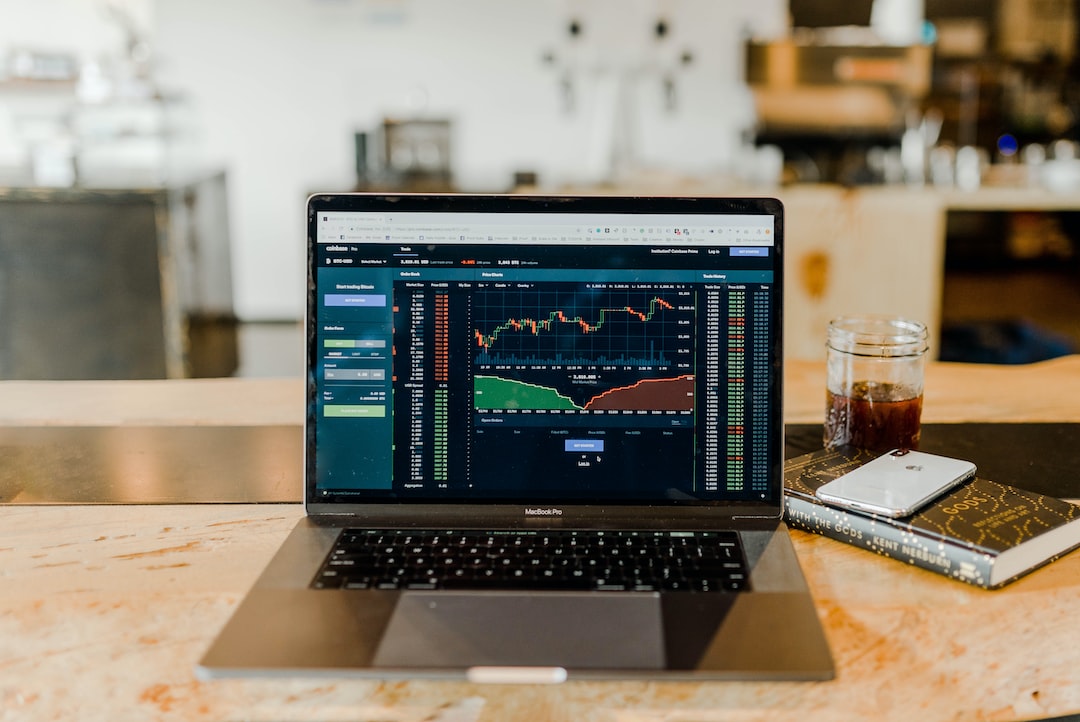
As a forex trader, it’s important to understand the different timeframes and their characteristics to make informed trading decisions. One of the most commonly used timeframes is the daily chart, which provides a longer-term view of the market and can help traders identify trends and key levels. But what exactly is the timeframe for a daily chart, and when does it begin and end?
The daily chart, as the name suggests, represents the price action of a currency pair over a single day. Each candle on the chart represents one trading day, with the opening and closing prices, as well as the high and low of the day, displayed in a graphical format. This timeframe is often used by swing traders and position traders who aim to capture medium to long-term trends in the market.
In terms of when the daily chart begins and ends, it depends on the timezone and trading hours of the forex market. The forex market is open 24 hours a day, five days a week, and trading begins in Asia and ends in New York. Therefore, the daily chart begins and ends at different times depending on where you are in the world.
For traders based in the United States, the daily chart typically begins at 5 pm EST (Eastern Standard Time) on Sunday and ends at 5 pm EST on Friday. This is because the forex market follows the sun, with trading starting in Asia on Sunday evening and concluding in New York on Friday afternoon.
If you’re based in Europe, the daily chart begins and ends at different times due to the time difference. The forex market opens at 10 pm GMT on Sunday and closes at 10 pm GMT on Friday, which means the daily chart for European traders begins and ends at those times.
It’s worth noting that some brokers may use a different timezone for their charts, so it’s important to check the settings on your trading platform to ensure you have the correct daily chart timeframe.
The daily chart is a popular timeframe for a number of reasons. Firstly, it provides a longer-term view of the market, which can help traders identify trends and key levels. This can be useful for swing traders and position traders who aim to hold trades for several days or even weeks. Secondly, the daily chart can help filter out noise and false signals that may occur on shorter timeframes. This can make it easier to identify high-probability trading opportunities.
However, it’s important to remember that the daily chart is just one timeframe and should be used in conjunction with other timeframes and technical indicators to build a complete trading strategy. Traders should also be aware of major news events and economic releases that may impact the market and adjust their trading accordingly.
In conclusion, the daily chart is a popular timeframe for forex traders that provides a longer-term view of the market. The timeframe for the daily chart depends on the timezone and trading hours of the forex market, with trading beginning in Asia on Sunday evening and ending in New York on Friday afternoon. Traders should use the daily chart in conjunction with other timeframes and technical indicators to build a complete trading strategy and be aware of major news events and economic releases that may impact the market.


