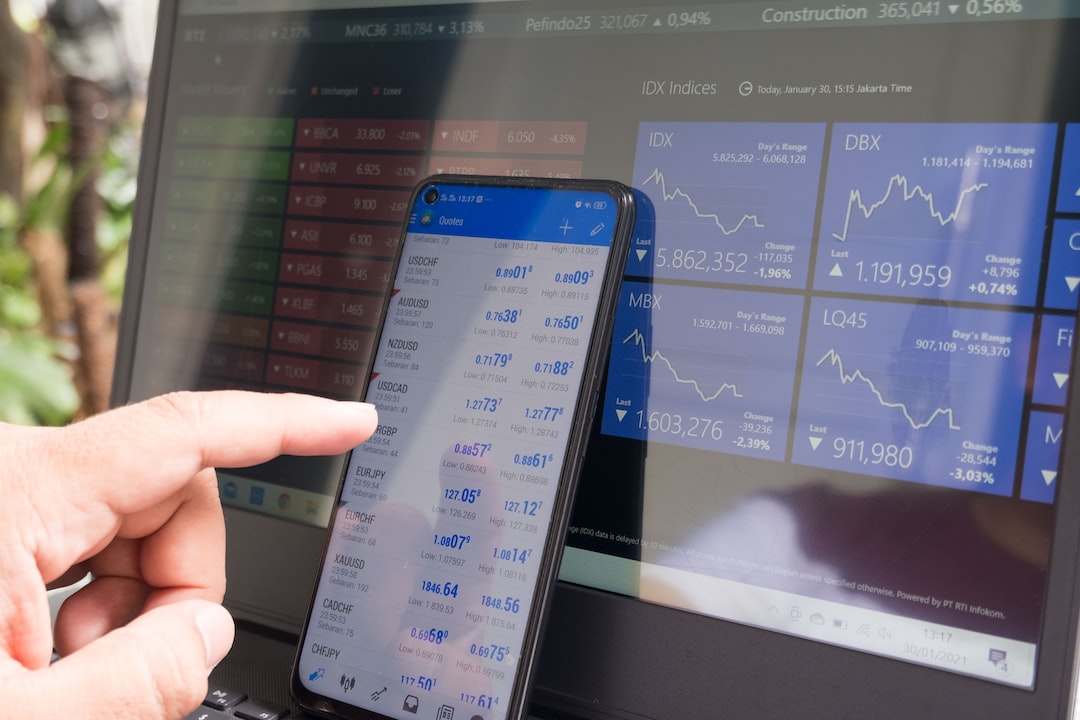
In the forex market, charting is an essential tool that traders use to analyze the price movements of currency pairs. Forex charting is a visual representation of the price action of a currency pair over a specific period. The charts are used to identify trends, patterns, and potential trading opportunities. One of the essential terms in forex charting is “candlestick.
A candlestick is a type of chart that displays the open, high, low, and close (OHLC) price levels of a currency pair over a specific period, typically one minute, five minutes, fifteen minutes, or one hour. The candlestick chart is formed by a series of candlesticks, each representing a specific period. The candlestick has a body and wicks or shadows that extend from the top and bottom of the body, which gives it its distinctive shape.
The body of a candlestick represents the opening and closing price of the currency pair over a specific period. If the closing price is higher than the opening price, the candlestick is bullish, and the body is usually colored green or white. If the closing price is lower than the opening price, the candlestick is bearish, and the body is usually colored red or black.
The wicks or shadows that extend from the top and bottom of the body represent the high and low price levels reached during the specific period. The upper wick represents the highest price level reached during the period, while the lower wick represents the lowest price level reached during the period.
The length of the body and the wicks of the candlestick can give traders valuable information about the strength and direction of the trend. For example, a long bullish candlestick with a short upper wick and no lower wick indicates that buyers are in control, and the price may continue to rise. On the other hand, a long bearish candlestick with a short lower wick and no upper wick indicates that sellers are in control, and the price may continue to fall.
Candlestick patterns are formed by a combination of candlesticks that can provide traders with valuable information about potential trading opportunities. Some of the most common candlestick patterns include the doji, hammer, engulfing pattern, and the harami pattern.
The doji pattern is formed when the opening and closing prices are the same, and the candlestick has a long upper and lower wick. This pattern indicates indecision in the market and can signal a potential reversal or continuation of the trend.
The hammer pattern is formed when the candlestick has a small body and a long lower wick. This pattern indicates that sellers have pushed the price down, but buyers have stepped in and pushed the price back up. This pattern can signal a potential reversal of the trend.
The engulfing pattern is formed when a small bullish or bearish candlestick is followed by a larger bullish or bearish candlestick. This pattern indicates a potential reversal of the trend.
The harami pattern is formed when a large bullish or bearish candlestick is followed by a small bullish or bearish candlestick. This pattern indicates a potential trend reversal or continuation.
In conclusion, candlesticks are an essential tool in forex charting that provides traders with valuable information about the price action of currency pairs. Traders can use candlesticks to identify trends, patterns, and potential trading opportunities. Understanding candlestick patterns can help traders make more informed trading decisions and improve their chances of success in the forex market.


