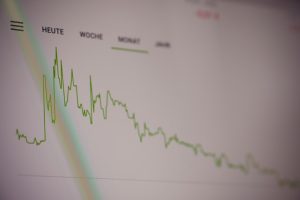
Forex option charts are a graphical representation of the price movements of currency options. These charts help traders analyze the market and make informed decisions about buying or selling currency options. The charts are used to identify trends, support and resistance levels, and other important indicators that can help traders predict future price movements.
Forex options are financial derivatives that give the holder the right, but not the obligation, to buy or sell a currency pair at a predetermined price and time. Options are different from futures or spot markets, where currencies are bought or sold at the current market rate. Options provide flexibility and allow traders to manage their risk exposure more effectively.
Forex option charts are essential tools for traders who want to make informed decisions about their investments. These charts provide a visual representation of the price movements of currency options, allowing traders to identify trends and patterns in the market. By analyzing the charts, traders can develop trading strategies that take advantage of market fluctuations and minimize losses.
One of the most common forex option charts is the candlestick chart. Candlestick charts show the opening, closing, high, and low prices of a currency option during a specified period. The candlesticks are colored differently depending on whether the price increased or decreased during the period. Green or white candles represent price increases, while red or black candles represent price decreases.
Another popular forex option chart is the line chart. Line charts show the price movements of a currency option over time using a simple line. This chart is useful for identifying long-term trends in the market.
Forex option charts also include technical indicators that help traders make informed decisions. Technical indicators are mathematical calculations based on the price and volume of a currency option. These indicators can help traders identify support and resistance levels, trend lines, and other important indicators that can be used to predict future price movements.
One of the most common technical indicators used in forex option charts is the moving average. Moving averages are calculated by averaging the prices of a currency option over a certain period. Traders use moving averages to identify trends and to determine support and resistance levels.
Another important technical indicator used in forex option charts is the Relative Strength Index (RSI). The RSI is a momentum oscillator that measures the strength of a currency option’s price movement. The RSI can help traders identify overbought or oversold conditions in the market.
In conclusion, forex option charts are an essential tool for traders who want to make informed decisions about their investments. These charts provide a visual representation of the price movements of currency options, allowing traders to identify trends and patterns in the market. By analyzing the charts and using technical indicators, traders can develop trading strategies that take advantage of market fluctuations and minimize losses.


