Easily one of the most effective forex trading strategies is to take advantage of prevailing trends in price movements – but how do you identify trends and why are they important?
Keeping It Simple
There are so many forces combining and intersecting to affect the price of a currency pair that it’s impossible to pick out one, split it off from the rest of the flock, and reliably analyze it in any meaningful way. There are just too many factors working together. Global news events, national government policies, central banks, big private market players, and a multitude of other components and ingredients all act upon one another and are filtered through the minds of millions of traders and how they perceive what’s happening in the world. It’s better, overall, to think of the market as a giant blender that takes all of that information – all the known knowns, known unknowns, and unknown unknowns – and swirls them all together. The resulting blend is the price of a currency or security.
In a way, it doesn’t really matter what you know. The market simply doesn’t care. Even if you feel you have some golden piece of information about some upcoming news events or anything like that, the market doesn’t care. It doesn’t matter what you know as much as it matters what everyone trading that currency knows. Even then, there are too many other contributing factors – like what the big players know and what they think the little guys they prey on know. If you think too long about it, the way the markets work becomes so complex that it gets harder and harder to wrap your head around it.
So what do you do in a situation like that? How are you supposed to take the information you have available to you at the moment to make predictions about the price movements in the future? Even in the immediate future? It’s a question as old as the hills and it’s the crux of what every trader out there is trying to do in one way or another.
One answer is to simplify things for yourself. Yes, the market is driven by this myriad of interlocking, interacting forces that would take all of the world’s supercomputers, linked together and working in concert to work out… And even then they couldn’t do it. But, when all is said and done, the price of a currency is still, ultimately, just an expression of the balance between buyers and sellers. Some traders will say that, at the end of the day, a trader’s job isn’t to know what affects the market. In short, the argument goes that you don’t even have to care what the underlying fundamentals are because you’ll never outsmart the market.
If you’ve simplified it down to the point that you don’t know, can’t know, or shouldn’t even care what moves the market, all that’s left is to you is to play the market that’s there in front of you. No wishing or hoping what it might be, no trying to outwit the market, just taking what’s actually there and using it to your advantage.
Going with the Flow
Everyone out there who’s doing any kind of trading – whether they’re a pro trader or just dabbling to try to supplement their income – wants nothing more than to be a consistent trader. Achieving consistency is probably one of the most important goals you should have in terms of how you execute your trades. And there’s only one way to start heading towards that goal. In order to achieve consistency in your outcomes, you have to be consistent in how you conduct yourself.
Trend trading is arguably the best, most efficient, and most effective way to approach the levels of consistency you should be aspiring to. And if that sounds like a bold claim, you should know that there are proper scientists, academics, and statisticians out there at highly prestigious learning establishments who have put in time and money, and intelligence into assessing these things. There are actual peer-reviewed studies that support the claim that trading by following trends is the most effective way to trade.
Being on the right side of an already established trend is a simple and effective way to give your trading system an advantage it couldn’t otherwise have. And the simplicity – which folds into the keep it simple philosophy outlined above – is the most beautiful part of this approach. In a sense, there’s nothing much to it. Almost anyone can take a look at a chart where there is a trend emerging in the price movement and be able to say, “yup, that’s definitely heading upwards” or, “oh yeah, that’s going down”. Although it would be great if it really was literally that simple, there is a point in reducing it to just that level of analysis because, when comes down to it, identifying a trend is the critical part of this approach to trading. Now, of course, it isn’t actually as simple as pointing at a line on a chart that’s going up and saying, “duh, that’s an upward trend” but the underlying point remains – trend trading is as simple as identifying a trend and using it to make winning trades.
Sadly, when you actually open a chart and start putting money on the line in real-world trades, you are faced with a number of very scary problems. Sure the price of currency X vs. currency Y has been going up for the past five trading sessions but what if that’s it for the trend and it reverses tomorrow? What if I put my money in and it switches? What about pullbacks? Alternatively, how do you know that the price heading upwards isn’t just part of a longer ranging movement instead of the start of a trend? The fact is, you can never know what part of the trend you are at right now. But that’s where deploying the tools, indicators, and know-how you have built up as a technical trader comes into play. Technical analysis is what will set you apart from just any idiot pointing at a chart and saying, “looks like it’s going up”.
Identifying Trends
The most obvious way to identify a trend is to believe your own eyes. Looking at a chart and knowing the right signs is your first step towards properly appraising whether a price movement is an actual, tradeable trend. This means that you need to know some of the key identification characteristics. If this sounds basic, that’s because it is. But that doesn’t mean that you can ignore the basics and it’s always worth revisiting them for the sake of refreshing your knowledge and for those traders who are just starting out and still putting together their trading systems.
Obviously, a trend is when the price moves in one direction or the other – either upwards or downwards. But since nothing in the market is that consistent for very long, there will always be oscillations and it is important to understand that they may or may not be departures from the trend. Some pullbacks will actually be a signal that the trend has lost steam and that it is coming to an end. Other pullbacks will be simply that, a short-term movement of the price in the opposite direction before the trend continues on its way. These pullbacks will result in mini peaks and troughs in the price movement – often called swing highs and swing lows. In a trending market, you are looking for those swing highs and swing lows to follow a distinct pattern.
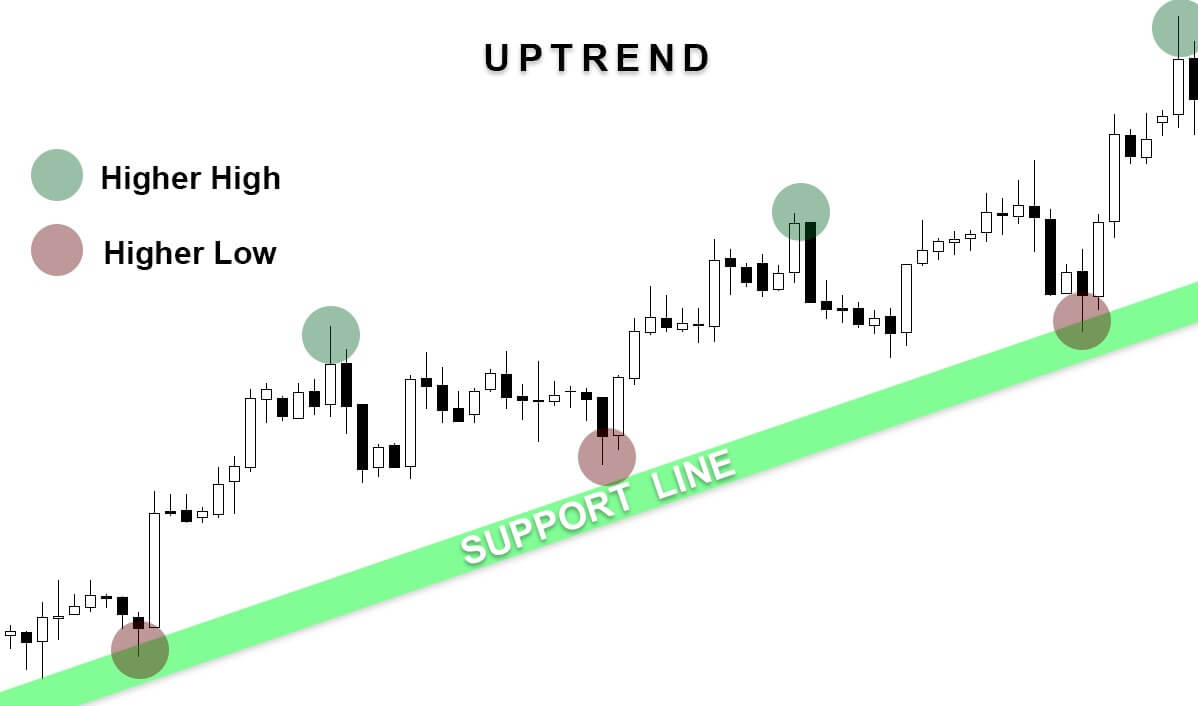
In the example of an uptrend, the swing highs should be coming in higher and higher each time and the swing lows should also be higher than preceding swing lows. That way, you get a structure where each swing high is coming in at a higher level than its predecessor, as is each swing low. The peaks outperform previous peaks and the troughs also outperform those that came before. This gives you your classic uptrend pattern. A downtrend is the same but in reverse, with the swing highs coming in lower and lower and the swing lows following suit.
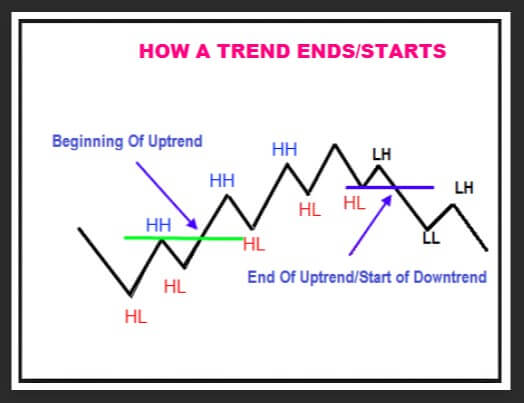
If you are not seeing this pattern, you are not looking at a trending market. Alternatively, if you did have this pattern in place for a while but it starts to break down, this is a sign that the trend is likely to be running out of steam and could settle into a ranging market or could fall into a reversal.
This is all very well and good if you go into your charts and look at historical price movements. You will have no problem coming across past trends and saying to yourself, “yup, that was a nice little trend right there”. But if you want to apply this to your trading, you will come up against the classic problem of not being able to see the future. Sure you might be looking at something that looks to all intents and purposes like a trend unfolding before your eyes but, because you don’t have a magic crystal ball on your desk, you have no idea if the next pullback will be the one that sends the price rocketing in the opposite direction.
So, while eyeballing the charts is an important starting point, it doesn’t get you very far on its own. You will need to deploy a combination of other techniques to get confirmation that the trend you are looking at has legs on it and will continue long enough for you to enter a worthwhile trade.
One approach is to couple your Mark 1 Eyeball with a moving average. If you are looking at an uptrend, you might want to take a look at a moving average covering a significant period (20 days, say). Here you will ideally want to see the price consistently staying above the moving average the whole time. If the price doesn’t remain reliably above the moving average the signal that this is a strong trend is flaky at best and you are probably looking at a weak trend or even a choppy market. Also, if you are looking at an uptrend, all the swing highs and lows are falling into place and the price is staying above your moving average, an additional confirmation will come in the form of the moving average itself rising during the trend. Remember, this shows that the average price has been steadily increasing recently and is a good additional sign that this is a reliable trend.
A good tip is to also combine two moving averages that will give you a picture of two time periods – for example, a 20 day and a 50 day moving average. If both of your moving averages are rising, this is even more solid confirmation of the uptrend. The degree by which the moving averages are rising is also an indication of the strength of the trend – if they are starting to flatten out, the trend might be taking a break or even coming to an end.
Using moving averages is one way of getting additional confirmation that the pattern you are looking at is indeed a trend but it isn’t a reliable way of getting you into a trade because you will be sitting around waiting too long before they show you what you need to know. By that time the price could have moved significantly and you will already be late coming into the game. For that, you will need to pair up your visual appraisal of a trend and your moving averages with an additional indicator that will actually be able to lead you into a useful trade.
Finding a Trend Indicator
One really great thing about being a forex trader these days is the absolute plethora of various technical indicators available to you that are out there just waiting to be discovered. There are literally thousands of indicators out there and this is a huge potential advantage to you, the individual trader, looking to get an edge and develop a reliable trading system. On the other hand, the sheer number of indicators does also lead you into the paradox of choice. How do you know which ones are good and which ones suck? Well, one way is to just go out and thoroughly test every indicator you come across but who has the time for that? If you do, great. But most people will want some guidance on which indicators perform well and which ones don’t. You will still have to do some testing of indicators to double-check that they really do work, scan them for repainting or other bugs, and to make sure that they work the way your trading system needs them to. But even so, you will need a clear set of criteria that will guide your search for your trend indicator so that you know what you are looking for and also so that you can recognize what you need when you find it.
First of all, you will need a trend indicator that doesn’t lead you into a trade too early on in the game. Lots of indicators out there will throw out trade signals at the drop of a hat that you then have to work hard to filter out because, inevitably, most of those trades will not be winners. A trend indicator that’s too wild is not your friend because it’s likely to tell you there’s a trend emerging even when that’s not the case. The market isn’t always trending and so a wild indicator will get stopped out more often than not.
Conversely, you don’t want an indicator that gets you into a trade way too late. First of all, because you will end up waiting for weeks or even months before it signals a trade and in that time you could have missed a whole host of potentially profitable trades while your indicator was silent. Even more importantly than that is that a slow indicator might take you into a trade when most of the trend has already run its course. You’ll just be coming in at the end when the pickings will be at their slimmest or when you’ll take home nothing at all. Just because an indicator is choosy when it comes to signaling a trade, doesn’t necessarily mean that the trade it does take you into is going to be a good one.
Getting the right balance between these two extremes is where the art meets the graft. There is simply no way of taking a short-cut through the work you are going to have to do to pick out an indicator that works for you. Using the above guidelines only gets you so far. And that’s no small thing. Being able to eliminate indicators early on in your testing process will save you a ton of time but you will still have to put the work in to find those little nuggets of gold.
That said, you will also have to show an awareness of the pitfalls of trend indicators. One of these is that they lead you into trouble if the market is choppy. Take, for example, the Parabolic SAR – an indicator lots of traders use as a trend indicator. Now, this thing is absolutely great if the market really is trending but it will reliably lead you into losing trades if the market is choppy or if it’s going sideways in a tight range. The way to avoid that is to combine it with other trend identification rules (like those above) to make sure you are using it in the right way. This doesn’t just go for the SAR, lots of indicators will only work the way they are intended if you combine them with other technical analysis tools like price action, chart pattern identification, and even other indicators like the moving average as described above. The way you hone this down to a working system is to put the whole thing through a rigorous testing procedure that will include backtesting and running it through a demo account to test it in a real-world environment.
What to Avoid
If you want to focus on following trends, you will want to want to avoid a currency pair that is displaying a sideways trend. This means that, in addition to becoming a master at identifying uptrends and downtrends, you will also need to get good at determining that the market is heading sideways and that it is time to go and look at other currency pairs for the moment. That is not to say that a sideways market is untradeable – if it is ranging regularly there might be trades to be made in there – but if you are looking just at following trends, this is not your time to shine.
A sideways market will display the exact opposite of the tell-tale signs we covered earlier – the swing highs and lows will not be progressing in a given direction and consistently forming higher and higher (or lower and lower for a downtrend) peaks and troughs and the price will be crashing through your moving averages in both directions.
Roundup
The things to take away here are that trend trading is the most effective way to gain an edge in your trading. You don’t need to take anyone’s word for that, you can go and find some of the academic and scientific studies that confirm this through rigorous study of trading effectiveness. They are out there and if you are the kind of person that gets some comfort from their ideas and beliefs being underpinned by a measurable scientific approach to something, then you will definitely benefit from finding these studies and reading through them.
Trend identification is ultimately a simple concept and you don’t have to make it more complicated than it is by overthinking it. But identifying a trend in real-time, in real-world conditions, and in a way that leads you into a trade that will result in you hitting your targets, well, that’s an art. To hone that art you will have to put in the work testing combinations of analytical approaches and indicators until you have a system that works reliably and that suits your own trading style.
Finally, trend trading is trading at its purest. You are trading the market as you see it before you, free of any confusing noise. The market doesn’t care what you think or feel about future price movements and neither should you. To be a successful trend trader you will have to focus on developing a trading system that you can rely on time and time again to tell you what the market is doing. Once you have that, you can focus on what your system is telling you, allowing you to trade with confidence.