We want you to have new ideas popping out about how you can trade different strategies or apply them directly, and that is exactly what we present in this article. The provided examples of successful trading, or more precisely how to use the most popular strategies without hassle, are all about the best practice of indicators and most successful setups.
Beginner traders fail even with the simplest of strategies, and this is not only because of the psychological strains and traps. Experienced traders went through all the real trading hassle and extracted the pros and cons of these strategies so you do not have to. The foundations in the following examples are a great base to look out for new components and improve on these trading concepts.
Before we begin, know no strategy is a holy grail as traders like to call their ideal system, there are market conditions that produce winners most of the time and when it is mostly losers. Also, different currency pairs or assets make them better or worse, depending on the price action specifics.
When you start trading, you lack knowledge about strategies and their components but more importantly, you lack the mental to hold them up. Truth be known, some indicators can be used in a different way than they are intended to, some creative traders even use them to a better success rate. One such example is the Williams %R indicator we wrote about. Back to the point, using an indicator or a strategy by their manuals is not always good for you, despite if you are a beginner. When you do not hold too much information then you do not have a bias. This bias can make you close up to certain trading techniques because you read several times it is not good or it can make you accept a general opinion that could be wrong for you.
Keep an open mind, what is bad for most does not mean it is for you too. Be curious and inspect. Take a look at the strategy original design first, then, try to trade it that way and think how it could become better. Now, by knowing more indicators, other trading theories, and even the math behind it, you know what to look for. As a beginner trader, you have to explore it all. Unfortunately, nothing or no one can just upload this to your mind like in the Matrix trilogy. Nevertheless, it is still better to walk and experience than to take the shortcut.
A classic used by many traders for a reason. It is simple and effective. Moving averages are lagging, trend indicative tools, but when they give you a signal, trends keep running. They are like big crude swords, slow hitting and requiring skill to master. The signals usually dig deep into the trend with great continuation positions. Here is our strategy with two Simple MAs set to Fibonacci periods. The faster one is set to 21 while the slower one is set to 55. It looks like this:
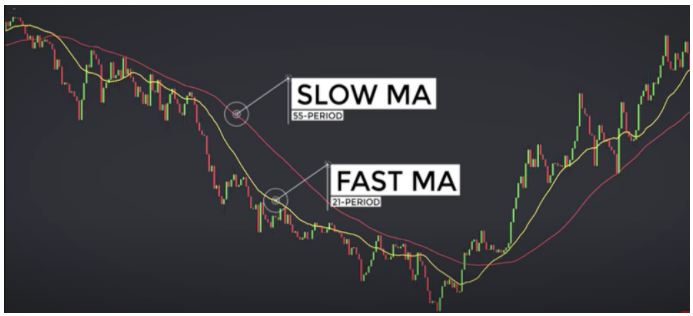
We can notice moving averages can show short and long-term trends depending on the settings. 21 and 55 periods are not obligatory, you can set any but make sure one is slower so together they can create an obvious distance between them. This distance is one of the key components of this MA strategy, not only the MAs.
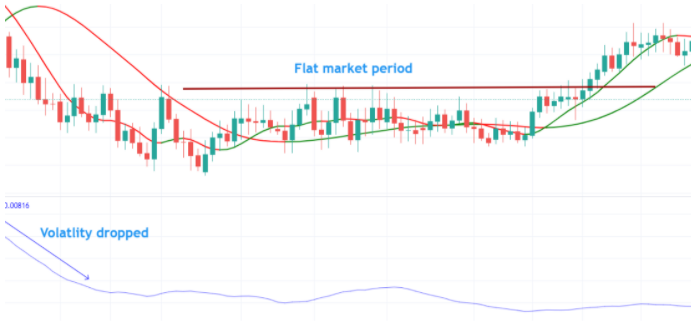
Moving Averages show you great entry and exit points but they are terrible when the market is flat. To cope with this, it is great to combine MAs with market energy measurements. Trends form when we have a driver that moves the price further. When there is none then the market is in equilibrium, moving averages are not pointing anywhere, they have no slope. In the next picture we have a recent flat period on the EUR chart, notice how two moving averages cross frequently and cannot determine a trend. Volatility dropped and remained low, an easy measure for the energy of the market. No energy – no trends.
Another way we can determine low energy is the mentioned distance between the MAs. The lower it is the less probability the trend will continue. On the other side, when this zone is wider there is an increasing probability the trend will slow down. Traders pay attention to this angle when looking to exit a trade or scale-out.
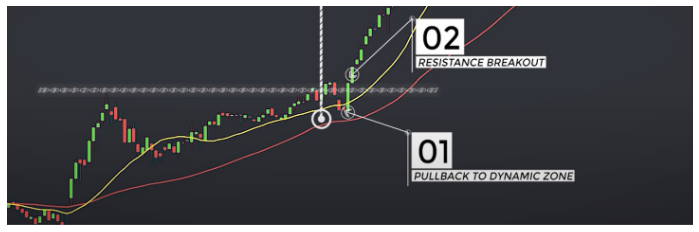
The MA zone is dynamic but does not exactly tell us when to exit or enter. For that, we need to have events that usually give us the best entry places. You can first start to observe what happens often that also proves to be good entries and exits. Then backtest your rules. In our example, we have set these events to be the price crossing the faster MA. When the price crosses into the zone, it is our exit point, if it bounces off the slower and back into the trend direction, it is our entry or continuation.
To increase the odds we add in a rule. To make sure the trend is really moving on or a new one is emerging, the price high outside the MA zone has to be higher than the previous high. It is a breakout.
Moving average crosses are not necessarily the best entry points. Observe if there is another way, for any strategy. What we have noticed is that price crossing the MA is the best compromise between entering too late, as in some cases when we wait for a crossover and entering too early. The price closing above or below both MAs, using the volatility, and the price action high/low breakouts is a winning combo.
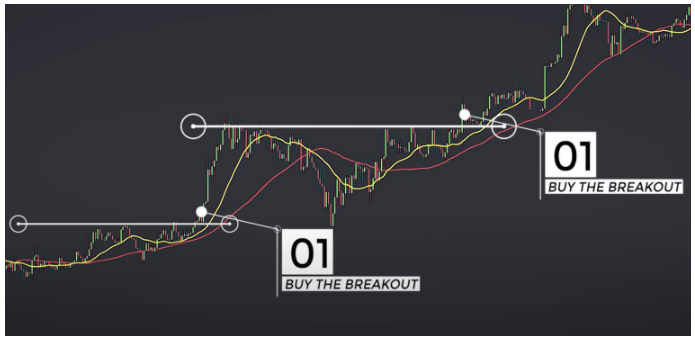
Pullbacks into the MA zone are common and actually a good re-entry opportunity. The next picture is a good example of reentry after a pullback in a bullish overall trend, but only after the previous high has been broken (white horizontal line):
Now, you can also combine candlestick patterns to determine a breakout, sometimes the breakouts using the previous high or low fail, so we want to have one more rule to eliminate losses. As with any strategy type, we can backtest and see what trades are losers we want to eliminate first. Aiming only to find good entries is not going to help us at one point, there is a limit to how much we can boost the win rate. Cutting losers is as effective as finding new winning rules, even if it means some winners are filtered too.
Risk management or where you put your Stop Loss is relatively easy to determine. One way to do it is by using the width of the MA zone to translate the Stop Loss distance the other way, below/above the slow MA. Then place Take Profit 1,5 times further to fulfill the preferable risk to reward ratio (better than 1:1). Here is one more example where a trader has found a continuation trade:
As the last interesting proposal, pay attention to the slow MA slope. When it is flat, do not try to trade and when it has a relatively strong slope, then do not enter any trades in the opposite direction. Trading reversals is tricky and does not provide better outcomes.
In the next article of the series, we are about to present a beginner-friendly strategy using the Heikin Ashi candlesticks which are especially beneficial for traders that react to the Price Action noise. If you often make trades that end quickly without much profit, check out the next article.