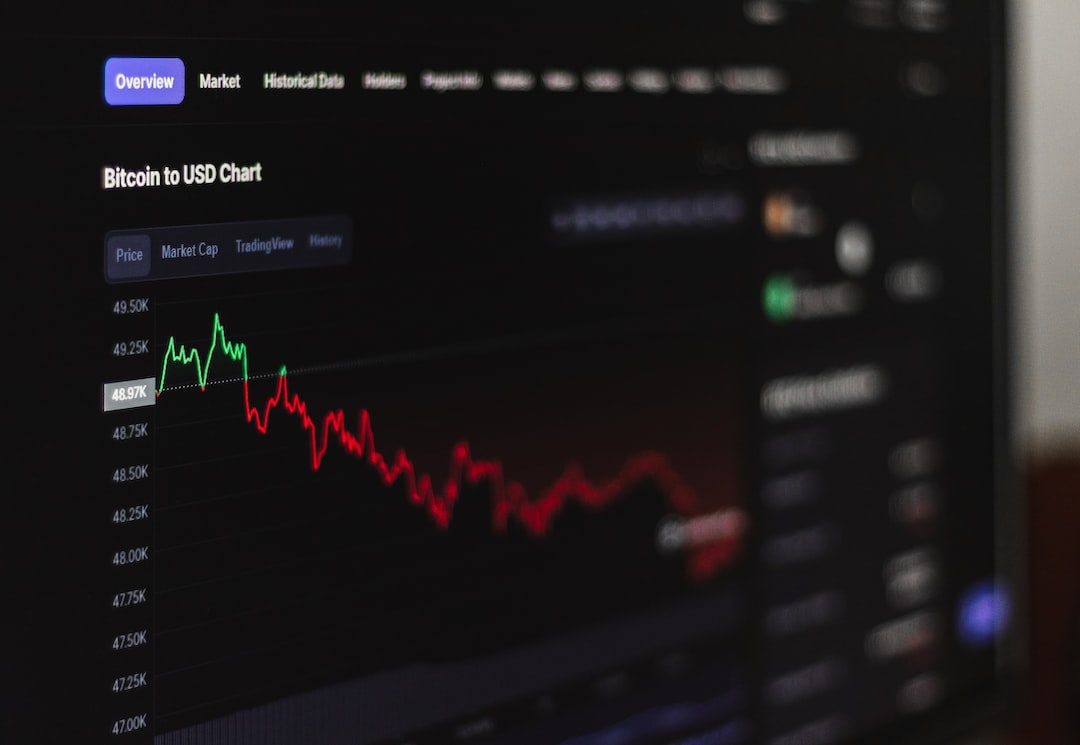
Forex trading is a great way to make money, but it can be challenging to find the strongest trends. Trends are the direction of the market or a specific currency pair. There are two types of trends: uptrends and downtrends. Uptrends are when the market is moving upwards, and downtrends are when the market is moving downwards. In this article, we will discuss how to find the strongest forex trends.
1. Use Moving Averages
The moving average is a technical indicator that is widely used in forex trading. It calculates the average price of a currency pair over a specific period. The moving average is used to identify the direction of the trend. If the moving average is moving upwards, it indicates an uptrend, and if it is moving downwards, it indicates a downtrend.
The most common moving averages used in forex trading are the 50-day, 100-day, and 200-day moving averages. Traders use these moving averages to identify the strongest trends. If the price of a currency pair is above the 50-day, 100-day, and 200-day moving averages, it indicates a strong uptrend. Conversely, if the price is below the moving averages, it indicates a strong downtrend.
2. Use Trend Lines
Trend lines are used to identify the direction of the trend. A trend line is a straight line that connects two or more price points. It is used to identify the support and resistance levels of a currency pair. Traders use trend lines to identify the strongest trends.
If the trend line is moving upwards, it indicates an uptrend, and if it is moving downwards, it indicates a downtrend. Traders use trend lines to identify the strongest trends and to enter trades at the right time.
3. Use Relative Strength Index (RSI)
The relative strength index (RSI) is a technical indicator that is used to identify the strength of a trend. The RSI is a momentum oscillator that measures the speed and change in price movements. It is used to identify oversold and overbought conditions.
If the RSI is above 70, it indicates that the currency pair is overbought, and if it is below 30, it indicates that the currency pair is oversold. Traders use the RSI to identify the strongest trends and to enter trades at the right time.
4. Use Moving Average Convergence Divergence (MACD)
The moving average convergence divergence (MACD) is a technical indicator that is used to identify the strength of a trend. The MACD is a momentum oscillator that measures the difference between two moving averages.
If the MACD line is above the signal line, it indicates an uptrend, and if it is below the signal line, it indicates a downtrend. Traders use the MACD to identify the strongest trends and to enter trades at the right time.
5. Use Price Action
Price action is the study of the movement of a currency pair. Traders use price action to identify the strongest trends. Price action involves analyzing the candlestick charts and identifying patterns and trends.
Traders use price action to identify the strongest trends and to enter trades at the right time. They look for patterns such as head and shoulders, double tops or bottoms, and trend lines to identify the direction of the trend.
Conclusion
Finding the strongest forex trends is essential for successful trading. Traders use various technical indicators and analysis tools to identify the direction of the trend. Moving averages, trend lines, RSI, MACD, and price action are some of the most commonly used tools. Traders should use multiple tools to confirm the direction of the trend and to enter trades at the right time.


