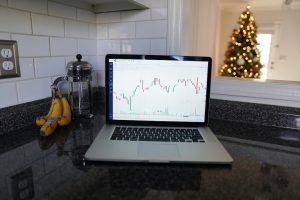
Forex candlesticks are one of the most popular tools used by traders to analyze price movements and predict future trends in the foreign exchange market. They provide a visual representation of the price action, showing whether the market is bullish or bearish, and can be used to identify potential trading opportunities.
A candlestick is formed by drawing a vertical line that represents the range between the opening and closing price of a currency pair during a specific time period, and a horizontal line that represents the range between the highest and lowest price during that same period. The body of the candlestick is created by filling in the area between the opening and closing price, and the color of the body can be either green or red, depending on whether the market is bullish or bearish.
A green candlestick indicates that the closing price was higher than the opening price, which means that the market was bullish during that period. In contrast, a red candlestick indicates that the closing price was lower than the opening price, which means that the market was bearish during that period.
The length of the candlestick body and the position of the opening and closing prices relative to the high and low of the period can provide valuable information about the strength of the trend and potential reversal points. For example, a long green candlestick with a small upper shadow and no lower shadow indicates a strong bullish trend, while a long red candlestick with a small lower shadow and no upper shadow indicates a strong bearish trend.
On the other hand, a candlestick with a long upper shadow and a small body indicates that the market opened high but closed lower, indicating a potential reversal point from bullish to bearish. Similarly, a candlestick with a long lower shadow and a small body indicates that the market opened low but closed higher, indicating a potential reversal point from bearish to bullish.
In addition to single candlestick patterns, traders also use multiple candlestick patterns to identify potential trading opportunities. For example, the bullish engulfing pattern occurs when a small red candlestick is followed by a larger green candlestick that completely engulfs the previous candlestick. This indicates a strong reversal from bearish to bullish and can be used as a signal to buy the currency pair.
Similarly, the bearish engulfing pattern occurs when a small green candlestick is followed by a larger red candlestick that completely engulfs the previous candlestick. This indicates a strong reversal from bullish to bearish and can be used as a signal to sell the currency pair.
In conclusion, Forex candlesticks are a powerful tool for analyzing price movements and predicting future trends in the foreign exchange market. They provide a visual representation of the price action, showing whether the market is bullish or bearish, and can be used to identify potential trading opportunities. By understanding the different candlestick patterns and their meanings, traders can make informed decisions about when to enter or exit trades and maximize their profits.


