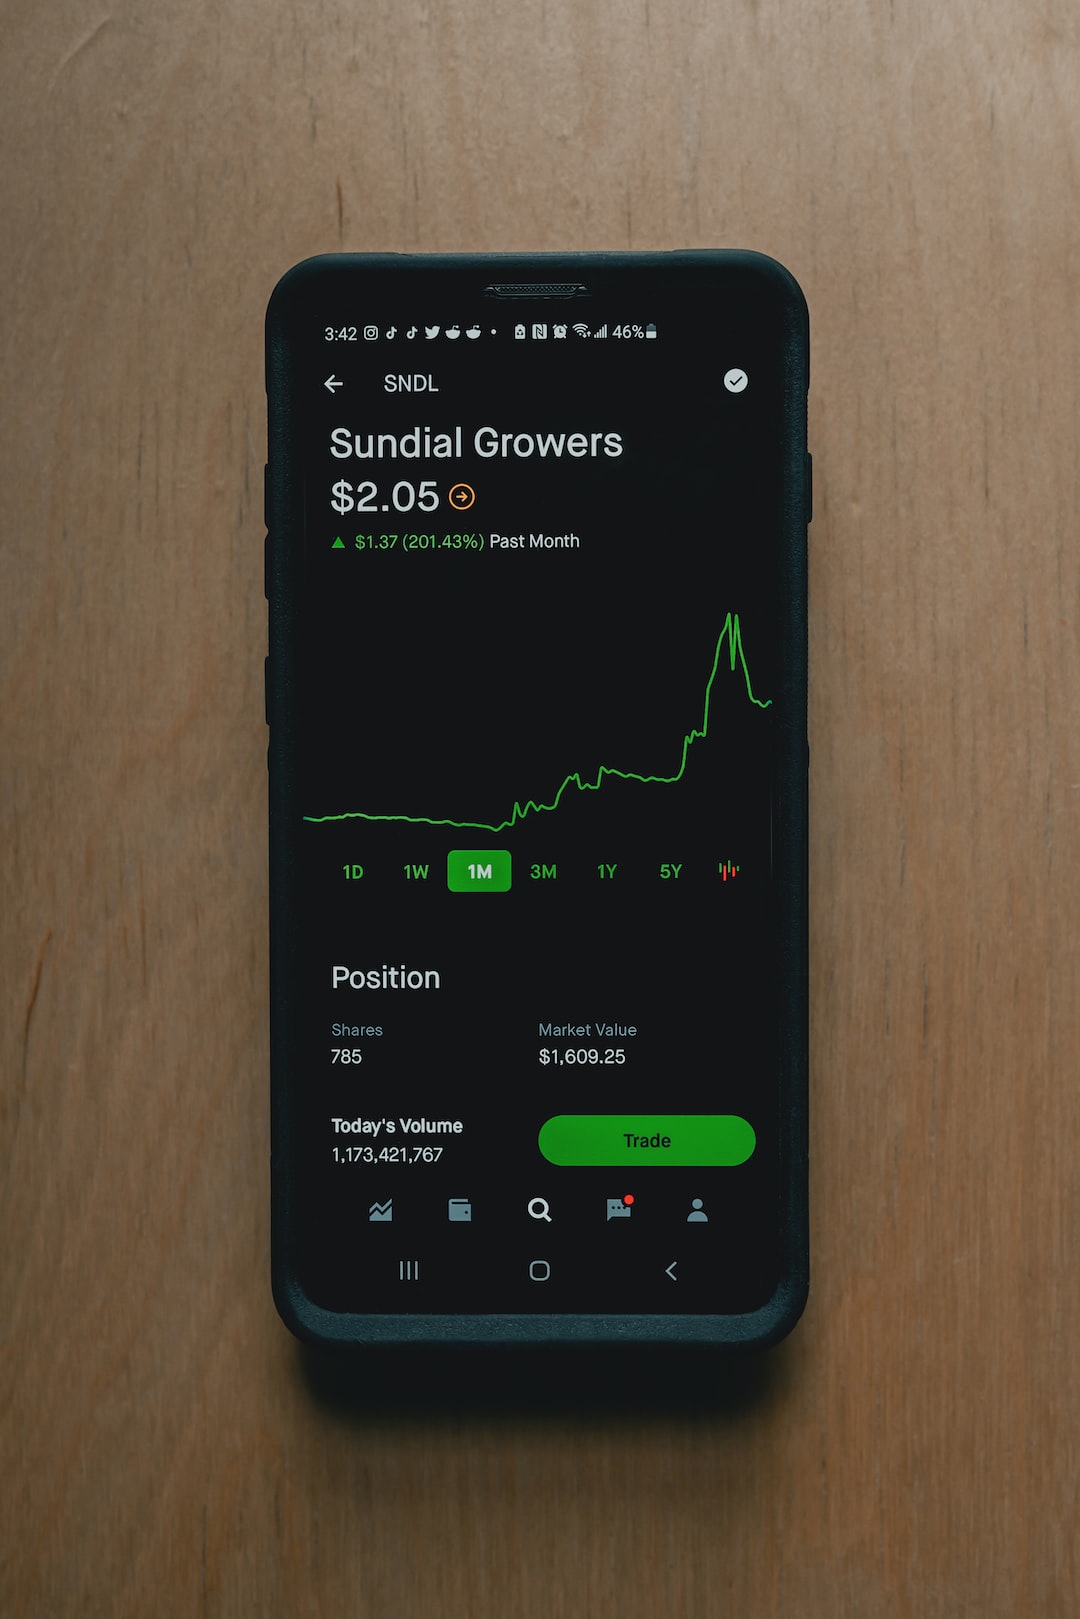
When it comes to trading in the forex market, momentum indicators are essential tools that traders use to assess the strength of a price trend. These indicators can help traders determine whether a trend is likely to continue or reverse, allowing them to make informed trading decisions.
However, with so many momentum indicators available, it can be challenging to know where to find the right one for your trading strategy. In this article, we’ll explore some of the most commonly used momentum indicators and where to find them.
1. Relative Strength Index (RSI)
The Relative Strength Index (RSI) is a popular momentum indicator that measures the speed and change of price movements. It oscillates between 0 and 100, with readings above 70 indicating an overbought market and readings below 30 indicating an oversold market.
The RSI can be found on most trading platforms as a default indicator. It can also be found on popular charting software such as TradingView and MetaTrader.
2. Moving Average Convergence Divergence (MACD)
The Moving Average Convergence Divergence (MACD) is another momentum indicator that traders use to identify trend changes. It consists of two exponential moving averages (EMAs) that oscillate above and below a zero line.
When the MACD line crosses above the signal line, it’s a bullish signal, indicating a potential trend reversal. Conversely, when the MACD line crosses below the signal line, it’s a bearish signal, indicating a potential trend reversal.
The MACD can be found on most trading platforms, including TradingView and MetaTrader.
3. Stochastic Oscillator
The Stochastic Oscillator is a momentum indicator that compares the closing price of an asset to its price range over a specified period. It oscillates between 0 and 100, with readings above 80 indicating an overbought market and readings below 20 indicating an oversold market.
The Stochastic Oscillator can be found on most trading platforms, including TradingView and MetaTrader.
4. Average Directional Index (ADX)
The Average Directional Index (ADX) is a momentum indicator that measures the strength of a trend. It ranges from 0 to 100, with readings above 25 indicating a strong trend and readings below 25 indicating a weak trend.
The ADX can be found on most trading platforms, including TradingView and MetaTrader.
5. Commodity Channel Index (CCI)
The Commodity Channel Index (CCI) is a momentum indicator that measures the deviation of an asset’s price from its statistical average. It oscillates between -100 and +100, with readings above +100 indicating an overbought market and readings below -100 indicating an oversold market.
The CCI can be found on most trading platforms, including TradingView and MetaTrader.
In conclusion, momentum indicators are essential tools for forex traders to assess the strength of a trend and make informed trading decisions. While there are many momentum indicators available, the RSI, MACD, Stochastic Oscillator, ADX, and CCI are some of the most commonly used.
These indicators can be found on most trading platforms, including TradingView and MetaTrader. It’s important to note that no single momentum indicator is foolproof, and traders should use them in conjunction with other analysis tools to make informed trading decisions.


