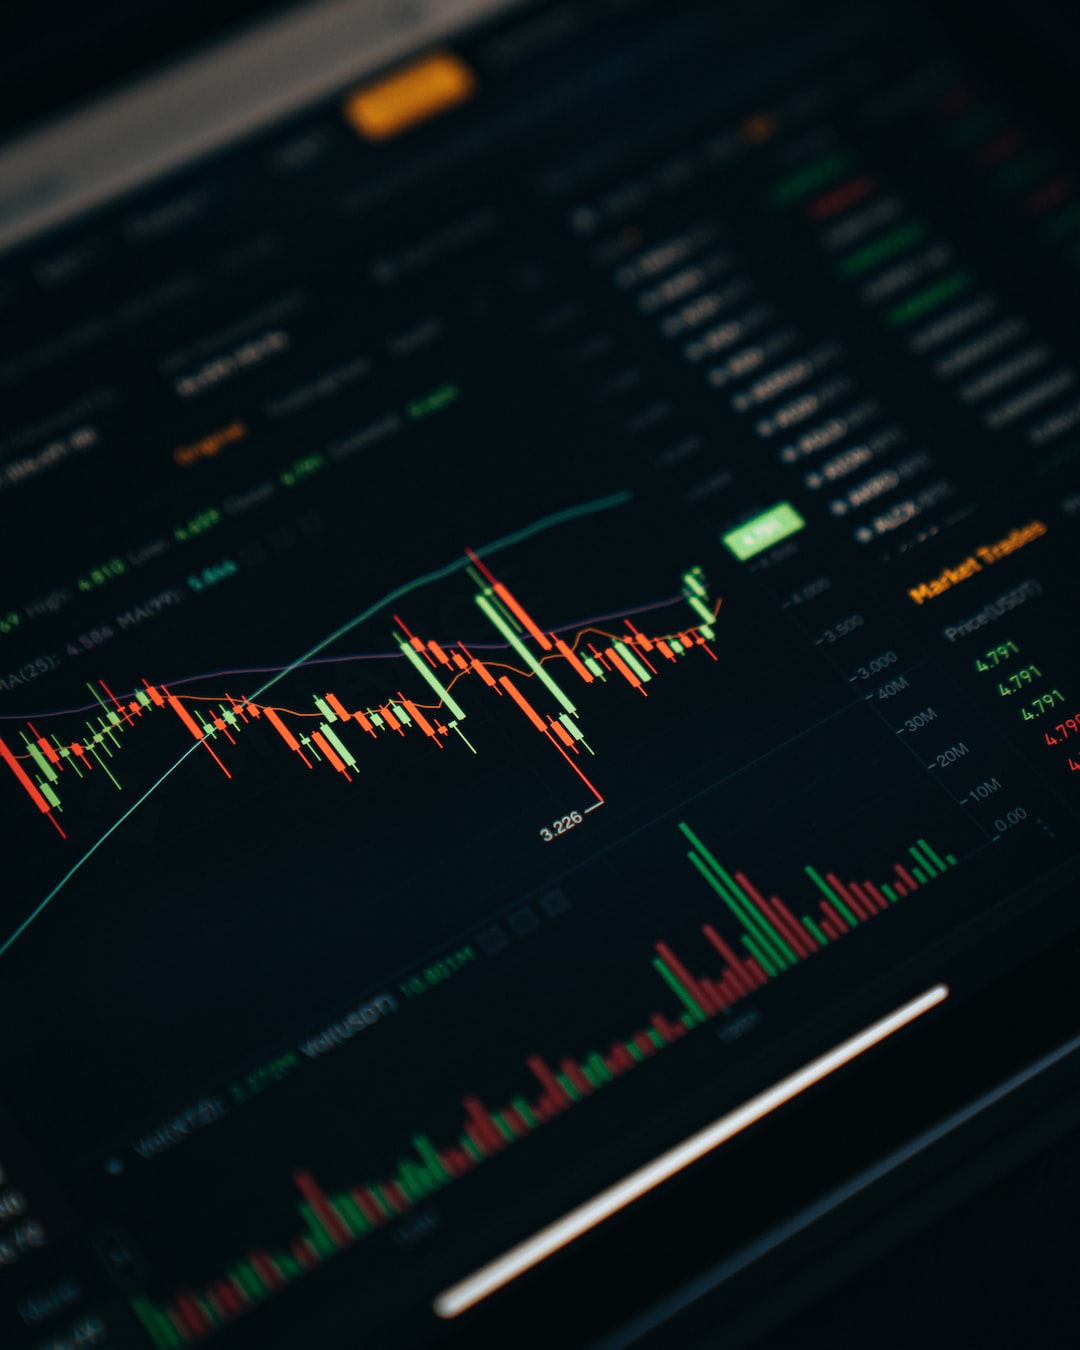
In the world of forex trading, the weekly candle is a key tool used by traders to analyze market trends and make trading decisions. Understanding when each weekly candle appears is critical for successful trading, as it can help traders plan their trades and manage risk effectively.
A weekly candle is a visual representation of price action in the forex market over a period of one week. Each weekly candle is made up of four smaller candles: the open, high, low, and close candles. The open candle represents the price at the start of the week, the high candle represents the highest price reached during the week, the low candle represents the lowest price reached during the week, and the close candle represents the price at the end of the week.
So, when does each weekly candle appear? The answer is simple: each weekly candle appears at the end of each trading week. In the forex market, a trading week typically runs from Sunday evening to Friday afternoon, with the market closed on weekends.
At the end of each trading week, the four smaller candles that make up the weekly candle are combined to form a single candle that represents the price action for the entire week. This candle is then added to the trader’s chart, allowing them to analyze the market trend and make trading decisions based on the information presented.
For example, if the weekly candle is bullish, with the close candle higher than the open candle, this indicates that the market is trending upwards. Traders may use this information to plan long trades or adjust their stop losses accordingly. Conversely, if the weekly candle is bearish, with the close candle lower than the open candle, this indicates that the market is trending downwards. Traders may use this information to plan short trades or adjust their stop losses accordingly.
It is important to note that the exact time at which each weekly candle appears may vary depending on the forex broker used by the trader. Some brokers may close their trading week at 5 pm EST on Friday, while others may close at 4 pm EST or even earlier. It is important for traders to be aware of their broker’s trading hours and adjust their trading strategies accordingly.
In addition to the weekly candle, traders may also use other candlestick patterns to help them make trading decisions. For example, the doji candlestick pattern indicates indecision in the market, while the hammer candlestick pattern may signal a potential reversal in the market trend. By combining these candlestick patterns with the weekly candle, traders can gain a more comprehensive understanding of market trends and make more informed trading decisions.
In conclusion, the weekly candle is a critical tool for forex traders, as it allows them to analyze market trends and make trading decisions based on current price action. Each weekly candle appears at the end of each trading week and is made up of four smaller candles: the open, high, low, and close candles. Traders should be aware of their broker’s trading hours and adjust their trading strategies accordingly to maximize their success in the forex market.


