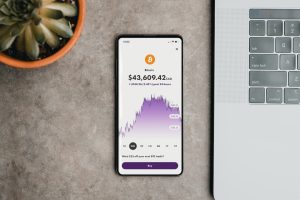
Forex traders use a range of tools and techniques to help them identify profitable trades. One such tool is the candlestick chart, which provides a visual representation of price movements over a given period. Candles are an essential part of this chart, and understanding what to look for in a forex candle is crucial to successful trading. In this article, we will explore the key elements of a forex candle and how to interpret them.

Firstly, it’s important to understand the basic structure of a candle. A candle consists of a body and shadows, also known as wicks or tails. The body represents the opening and closing price of the currency pair, while the shadows show the highest and lowest prices reached during the candle’s timeframe.
The length of the body of a candle is an essential element to consider. A long body indicates a significant price movement, while a short body suggests a minor price change. For example, a long green body indicates that the price of the currency pair has increased significantly during the candle’s timeframe. Conversely, a long red body indicates a significant decrease in price.
The length of the shadows is another important factor to consider. A long upper shadow indicates that the price of the currency pair reached a high level during the candle’s timeframe but ultimately closed lower. Conversely, a long lower shadow indicates that the price reached a low level but closed higher. These shadows can provide valuable insight into market sentiment, as they show the struggle between buyers and sellers.
Another important element to consider is the color of the candle. A green or white candle represents a bullish trend, indicating that the price is rising. A red or black candle represents a bearish trend, suggesting that the price is falling. Understanding the prevailing trend is crucial for successful trading, as it helps traders identify potentially profitable trades.
The size of the candle is also an essential factor to consider. Larger candles indicate a more significant price movement, while smaller candles suggest a lower level of volatility. Understanding the volatility of the market is crucial for managing risk, as highly volatile markets can increase the likelihood of unexpected price movements.
Furthermore, the relationship between candles can provide valuable insight into market sentiment. For example, a long green candle followed by a long red candle suggests that the market is experiencing a shift in sentiment from bullish to bearish. Conversely, a long red candle followed by a long green candle indicates a shift from bearish to bullish.
Finally, it’s essential to consider the timeframe of the candle. Longer timeframes, such as daily or weekly candles, provide a broader view of the market and can help identify longer-term trends. Shorter timeframes, such as 15-minute or 1-hour candles, provide a more detailed view of price movements and can help identify short-term trading opportunities.
In conclusion, understanding what to look for in a forex candle is crucial for successful trading. By considering the length of the body and shadows, the color of the candle, the size of the candle, the relationship between candles, and the timeframe, traders can gain valuable insight into market sentiment and identify potentially profitable trades. However, it’s important to remember that candlestick charts are just one tool in a trader’s arsenal, and should be used in conjunction with other technical and fundamental analysis techniques.