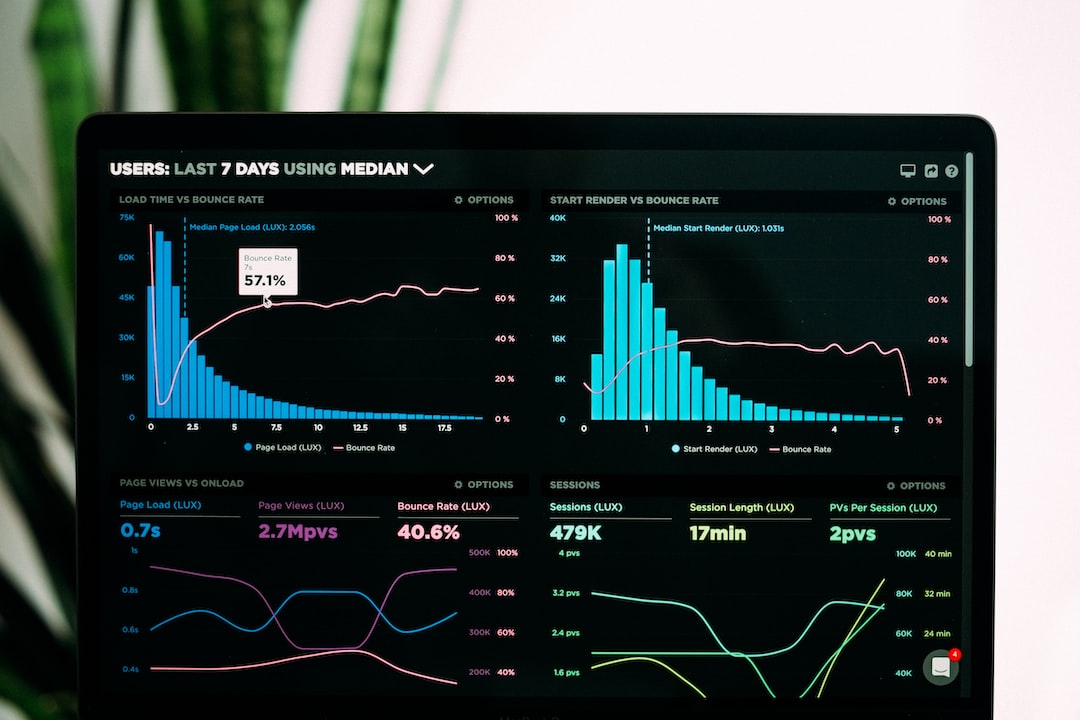
Forex charts are the backbone of technical analysis in the forex market. They serve as a visual representation of the price movements of currency pairs and provide traders with valuable insights into potential trading opportunities. One of the most commonly used chart types in forex trading is the candlestick chart. Candlestick charts are used to track the price movements of currency pairs over a specific period of time. The candles on these charts can be colored differently, with some being green and others being red. In this article, we will explain what makes a candle green in a forex chart.
First, it is important to understand the basic structure of a candlestick. A candlestick consists of a body and two wicks, also known as shadows. The body represents the price range between the open and close of the candle, while the wicks represent the highest and lowest prices reached during the period.
In a forex chart, a green candle is created when the closing price is higher than the opening price. This means that the buyers were in control during that period, and the price increased. The body of the candlestick is colored green to represent this upward movement. The length of the body indicates the strength of the bullish sentiment, with a longer body indicating a stronger momentum.
There are several factors that can contribute to the creation of a green candle in a forex chart. One of the most important factors is market sentiment. Market sentiment refers to the overall attitude of traders towards a particular currency pair. If the sentiment is bullish, meaning that traders believe the price will increase, it is more likely that green candles will be formed. This is because buyers will be more active in the market, driving up the price and creating a bullish trend.
Another factor that can contribute to the creation of green candles is economic data. Economic data refers to the reports and announcements released by governments and central banks that provide insight into the state of the economy. Positive economic data, such as strong GDP growth or low unemployment rates, can lead to an increase in demand for a currency. This increase in demand can lead to a rise in prices and the formation of green candles.
Technical analysis can also play a role in the formation of green candles in a forex chart. Technical analysts use various tools and indicators to identify patterns and trends in the price movements of currency pairs. If these tools indicate a bullish trend, traders may be more likely to buy the currency, leading to the formation of green candles.
It is important to note that the creation of green candles in a forex chart does not necessarily guarantee a profitable trade. Traders must consider a variety of factors, including risk management and market volatility, before making any trading decisions.
In conclusion, a green candle in a forex chart represents a period of upward movement in price. This movement can be influenced by a variety of factors, including market sentiment, economic data, and technical analysis. While the formation of green candles can provide valuable insights into potential trading opportunities, traders must exercise caution and consider all relevant factors before making any trades.


