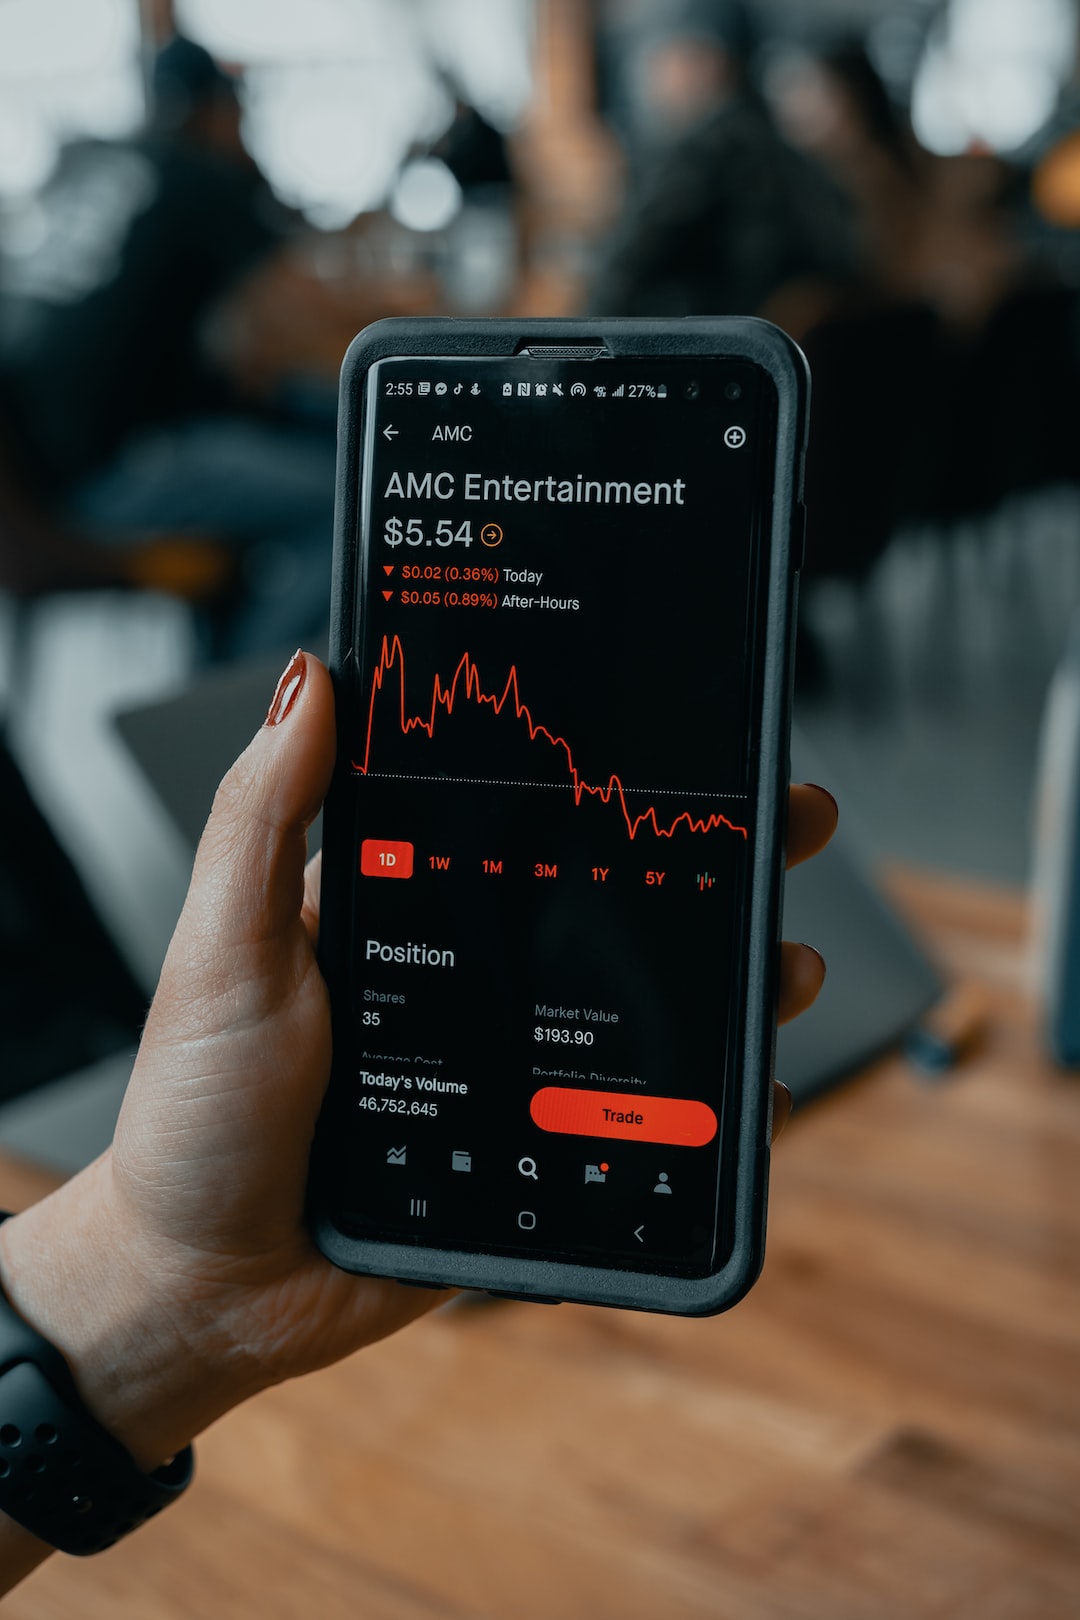
Forex trading is a complex business that involves buying and selling currencies based on their exchange rates. The exchange rates are affected by various factors, such as economic and political events, inflation rates, and interest rates. To make a profit, traders need to analyze these factors and determine the best time to buy or sell a currency. Time frames in forex refer to the duration of time that a trader uses to analyze the market. The most commonly traded time frames in forex are the daily, weekly, and monthly charts.
Daily Time Frame
The daily time frame is the most popular among forex traders. It is used for short-term trading, where traders hold their positions for a few hours to a few days. The daily time frame allows traders to identify trends and price movements that occur within a day. This time frame is suitable for traders who want to take advantage of small price movements and scalp profits.
The daily chart is also useful for swing traders who hold their positions for a few days to a few weeks. Swing traders use technical analysis to identify trends and patterns that occur over a few days. They look for entry and exit points based on price action and indicators such as moving averages and oscillators.
Weekly Time Frame
The weekly time frame is used for medium-term trading. Traders hold their positions for a few weeks to a few months, based on the trends and patterns that occur over a longer period. The weekly chart provides a broader view of the market and allows traders to identify long-term trends and price movements.
The weekly time frame is suitable for traders who want to take advantage of long-term trends and hold their positions for a longer period. Position traders use the weekly chart to analyze the market and identify potential entry and exit points based on fundamental analysis and technical analysis. They look for trends that occur over a few weeks to a few months and hold their positions until the trend reverses.
Monthly Time Frame
The monthly time frame is used for long-term trading. Traders hold their positions for several months to several years, based on the long-term trends and patterns that occur over a longer period. The monthly chart provides a broader view of the market and allows traders to identify long-term trends and price movements.
The monthly time frame is suitable for traders who want to take advantage of long-term trends and hold their positions for a longer period. Long-term investors use the monthly chart to analyze the market and identify potential entry and exit points based on fundamental analysis and technical analysis. They look for trends that occur over a few months to several years and hold their positions until the trend reverses.
Conclusion
In conclusion, the most commonly traded time frames in forex are the daily, weekly, and monthly charts. The daily chart is used for short-term trading, the weekly chart is used for medium-term trading, and the monthly chart is used for long-term trading. Traders use technical analysis and fundamental analysis to identify trends and patterns that occur over different time frames. Each time frame has its advantages and disadvantages, and traders need to determine which time frame suits their trading style and objectives.


