Oil price action in the past 5 years has been a headline, especially once the pandemic hit the world. The global activity shrank causing oil futures to plummet to zero. A rare occurrence like this is a fortune for some and misery to others. The steep decline attracted a lot of reversal traders picking the dips, unfortunately for them, the price kept going down to some would say impossible levels. Trend-following strategies enjoyed this plummet. A few years before, the price reached very high levels, you could see a lot of complainers about the price of gas and other derivatives, something they do not have control over. In every situation, there is someone who is not happy, however, you can be the one who just reaps the rewards when the oil goes up and down. There is a choice to be the one who is taking the hit or be the one who is hitting.
Trading oil will likely take a lot of trial and error when making a transition from forex trading. Oil, like precious metals, is a commodity, it is physical with real supply and demand. Whatsmore, oil can be a political tool, and it is also connected to world economic activity. It has been and still is one of the global primary energy sources. Consequently, your trading system will need adjustments before you get it right. If you are following our previous articles about the algorithm and the way we adjust it for precious metals trading after forex, you will quickly adapt it to oil.
Oil trading is done with the CFD contracts, meaning traders can go long and short like in forex and have leverage, although not as high as with forex. CFDs can have any asset underneath and leverage gives traders additional buying power if needed, however it is a double-edged sword for beginner traders without good risk management if any. CFDs on oil are not available in the US since the Dodd-Frank Act after the 2008 financial crisis. There are other ways to trade oil this way for US citizens, though.
Brent and West Texas Oil are the two oil types traded, both are popular yet certain prop traders think WTI oil is a better choice since the price action is smoother. Both charts are extremely similar so traders can pick one. Oil is expressed in the USD, at least that is the standard offer you will see on the broker list. Other currencies are redundant since oil does not really care how the dollar is doing, the effects of the dollar movements on the oil are not significant. According to certain prop traders, it’s probably the most detached asset from the USD after palladium. Since oil is traded in USD globally, some countries do not like this fact and are trying to introduce closed markets where the USD is not used, most of these countries are big oil exporters.
Natural Gas is also offered with better product range brokers, although natural gas price action is not very friendly, similarly when we compare gold and copper. Oil is far more traded asset so there is no need to take risks with other more exotic assets unless you have exhausted all other major markets. News about the USD is also one of the uncontrollable risks we do not have to account for since oil is very strict about its value, even when the USD is strong the oil price is steady. On the other hand, oil is very sensitive to global political events, such as war tensions, recent pandemic situations, and OPEC deals. So when we do fundamental analysis, we need to pay attention to a completely different set of news and events. These events are for most of the time unexpected and unscheduled, an uncontrollable risk we have to accept if we trade oil. There is nothing we can do, these events just pop up but we can still be positive in the long run regardless. The price after such events may spike but understand these are not common events and the spikes are not always going to adversely affect your trade. After all, you may be ending by having profit spikes since the events can cause the price action in the direction of an already established trend, further pushing it. We will address one point where oil price reaction could have ruined your trade later.
Correlation with oil is one of the most popular technical analysis we see, yet be warned correlations come and go and cannot be applied effectively in trading according to prop traders. Correlations are commonly explained by many educational websites and books but in practice, they are not consistent enough for traders to rely on. You can test this claim in a demo account if you can make a trading plan that identifies conditions for a trade entry, following the correlation between assets. The Canadian dollar is commonly explained as the currency to go if you want to use price action information for trading oil. CAD is considered positively correlated to oil, still, you can see if this is true and how consistent it is. Now, when the oil price action is mostly flat since the COVID-19 pandemic extreme bearish move, we cannot see a steady correlation to CAD at all. In the picture below we have marked sections where there is a positive correlation between CAD (orange line) and WTI (black line) into no correlation and even into a negative correlation period, all separated by green vertical lines.
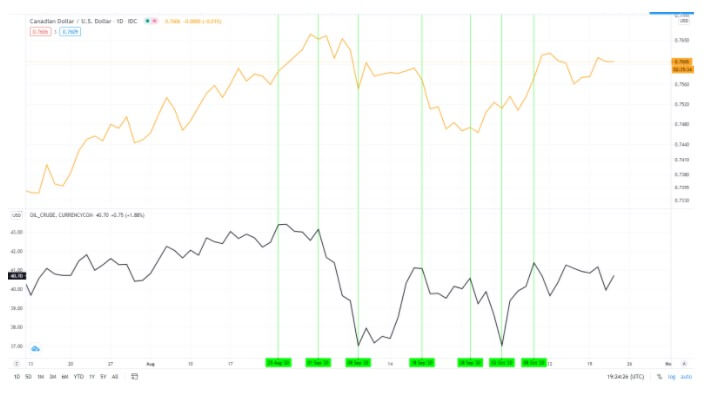
If somehow you have a plan for how to use this correlation period, you would likely have more losses than winners in the future giving how inconsistent it is.
Brokers will have different product symbols in the platform list for oil CFDs, for example, “WTI”, “US Oil”, “USOUSD” or “WTIO” for WTI oil, and “UK Oil”, “UKOUSD” and so on for Brent. Brent oil is like silver is to gold when we talk about price action and volatility. It has more choppy periods, sudden moves and generally is less smooth than WTI. Since we are trading just one of them, you can pick WTI. The charts between the two oil types almost look the same, just Brent is a bit more amplified.
If you are using the ATR indicator to measure the volatility of oil assets, you will notice it is the same as with the JPY currency pairs. Volatility is an important part of the algorithm we have talked about in previous articles and oil does not have anything different here. Trends need volume or volatility to keep the trend going, otherwise, we end up trading false breakouts. Trading precious metals required some changes from forex but trading oil retains the relation of volume to trends.
Not that ATR value can be different on the same oil asset but with different brokers. Sometimes this difference is dramatic; it can affect your position sizing (for the ones using our system). The reason for this might be because some brokers record Sunday flat candles (periods). When these count into the ATR they drastically lower its value. If you think this changes something you are wrong. Your position size might be a bit larger for the lower ATR but the end pip performance is the same. After all, just pick the broker you like regardless of this chart behavior.
The algorithm structure is the same except we do not include the baseline. The baseline element does not have a good effect on trading since we have supply and demand, and this also opens room for reversal trades. The algorithm structure also contains two confirmation indicators and one trade exit dedicated indicator. These indicators need to be switched for some that perform better on oil. Of course, in some cases your forex or precious metals indicators may work as well but know if the system is not giving consistent results, switch these first. Note both precious metals and oil are commodities, so start with the algorithm made for metals and then make adjustments if needed. You will probably find indicators that work better on oil and even small odds in your favor per trade create drastic performance differences at the end of the year.
Now about the events you cannot control regarding the oil, if you follow political events, after 13th September 2019 an Iranian oil tanker got shot and caused the incident in the oil market. The price went up but your pending orders, more importantly, Stop Loss orders would get passed. The gap when the price opened was extreme to the point it resembles a flash crash in forex. According to the price action, you could be in a long position as we see higher lows and highs before the spike, or you could have avoided all of this if your volume/volatility indicator filtered the signal. However, even if you were in a short position, do not let this loss deter you. It is the long game you are aiming at, just move on as nothing happened. These events are very rare, nothing similar can happen in the next decade, anomalies are part of the trading. Some traders could leave these positions open after the spike in hope of a reversal since the jump was extreme, but traders that follow a system accept the loss. The worst-case scenario for those that left the position open is now a possibility, the price could have continued up and cut a large part of their account or completely erase it depending on how long they wait for a reversal. This damage can only be repaired with year-long profitable trading. Those who cut the position immediately, they are still profitable at the end because it is the long game that matters. They will embrace this loss every time.
In conclusion, add oil into your trading arsenal if you are already successful with forex and precious metals. The algorithm that works with metals is going to work with the oil too, and with adjustments, you will have another profit maker asset. Unpredictable events with oil are part of the trading risk you will need to take, but this will not make a dent in your overall, year after year performance. Don’t worry about the USD strength, trade it even before the USD important event. The knowledge you have with trading and the algorithm you have created is universal, and by knowledge we also mean the skill set and the mindset. The testing phase for every system is a must, do not expect great results just because one system is good with forex currency pairs. Oil is something completely different fundamentally and technically.