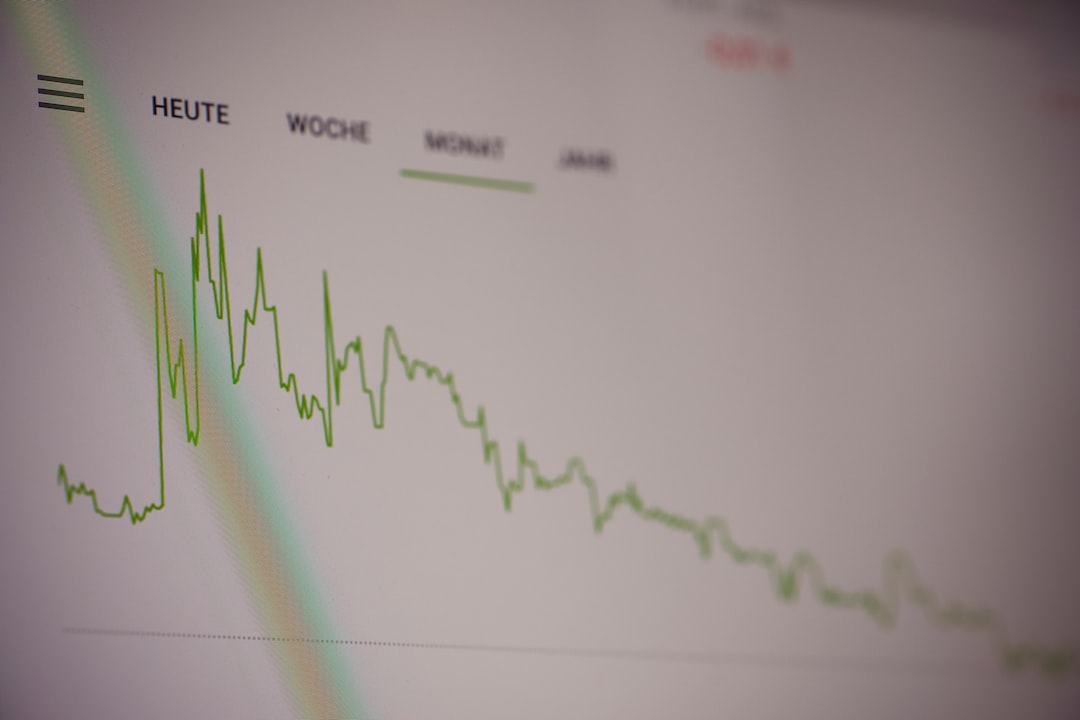
RSI, or the Relative Strength Index, is a popular technical analysis indicator used by forex traders to identify overbought or oversold conditions in the market. Developed by J. Welles Wilder Jr. in 1978, the RSI measures the strength of price movements in a currency pair over a specified period of time. It oscillates between 0 and 100 and is often used as a momentum indicator to identify potential trend reversals. In this article, we will discuss how to use RSI in forex trading.
Understanding RSI
The RSI compares the average gains and losses of a currency pair over a specified period of time, typically 14 days. The formula for calculating RSI is as follows:
RSI = 100 – (100 / (1 + RS))
Where RS (Relative Strength) is calculated as the average gain over the specified period divided by the average loss over the same period.
An RSI reading of 70 or above indicates an overbought condition, while a reading of 30 or below indicates an oversold condition. Traders use these levels to identify potential buying or selling opportunities.
Using RSI to Identify Trend Reversals
One of the most common uses of RSI in forex trading is to identify potential trend reversals. When the RSI crosses the 70 level from above, it is considered a bearish signal and indicates that the currency pair may be overbought. Conversely, when the RSI crosses the 30 level from below, it is considered a bullish signal and indicates that the currency pair may be oversold.
Traders can use these signals to enter or exit a position. For example, if the RSI crosses the 70 level from above, a trader may consider selling the currency pair as it may be overbought and due for a reversal. Similarly, if the RSI crosses the 30 level from below, a trader may consider buying the currency pair as it may be oversold and due for a reversal.
It is important to note that RSI signals should not be used in isolation and should be confirmed by other technical indicators and analysis.
Using RSI to Identify Divergence
Another use of RSI in forex trading is to identify divergence. Divergence occurs when the price of a currency pair is moving in one direction while the RSI is moving in the opposite direction. This indicates a potential trend reversal.
There are two types of divergence: bullish divergence and bearish divergence. Bullish divergence occurs when the price of a currency pair is making lower lows while the RSI is making higher lows. This indicates that the momentum of the downtrend is weakening and a potential reversal may be forthcoming. Conversely, bearish divergence occurs when the price of a currency pair is making higher highs while the RSI is making lower highs. This indicates that the momentum of the uptrend is weakening and a potential reversal may be forthcoming.
Traders can use divergence signals to enter or exit a position. For example, if there is bullish divergence, a trader may consider buying the currency pair as it may be due for a reversal. Similarly, if there is bearish divergence, a trader may consider selling the currency pair as it may be due for a reversal.
Conclusion
RSI is a popular technical analysis indicator used by forex traders to identify overbought or oversold conditions in the market, as well as potential trend reversals and divergence. Traders should not rely solely on RSI signals and should use them in conjunction with other technical indicators and analysis. It is important to remember that forex trading involves risk and traders should always practice proper risk management techniques.


