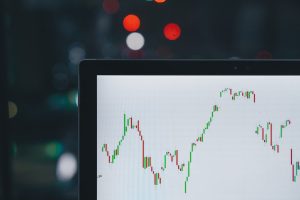
Candlestick charts are one of the most popular types of charts used in forex trading. They are widely used because they provide a comprehensive view of price action over a specific period. Understanding how to read candlestick charts can help traders to make informed trading decisions based on price movements. This article will explain how to read candlestick charts in forex trading.
Candlestick charts consist of individual candles that represent a specific period, such as one hour, four hours, or a day. Each candle has four main components: the opening price, closing price, high price, and low price. The candlestick chart can be used to analyze price action over a specific period by looking at the shape of each candle, the length of the wick, and the position of the candle relative to other candles.
The shape of the candlestick can provide clues about the strength of the trend. For example, a long green candlestick indicates that the price closed higher than the opening price, and the buyers were in control during the period. Conversely, a long red candlestick indicates that the price closed lower than the opening price, and the sellers were in control during the period.
The length of the wick can also provide valuable information. A long upper wick indicates that the price reached a high level during the period, but the sellers pushed it back down. A long lower wick indicates that the price reached a low level during the period, but the buyers pushed it back up. The longer the wick, the stronger the rejection of the price at that level.
The position of the candle relative to other candles can also provide valuable information. For example, if a long green candlestick is followed by a long red candlestick, it indicates that the sellers have taken control, and the trend may be reversing. Similarly, if a long red candlestick is followed by a long green candlestick, it indicates that the buyers have taken control, and the trend may be reversing.
The size of the candlestick can also provide valuable information. A small candlestick indicates that the price did not move much during the period, and the market may be consolidating. A large candlestick indicates that the price moved significantly during the period, and there may be a strong trend in place.
Candlestick charts can also be used to identify patterns that can provide valuable information about future price movements. Some of the most common candlestick patterns include:
1. Doji: A doji is a candlestick with a small body and long wicks. It indicates that the market is indecisive, and there is no clear trend. A doji can indicate a possible trend reversal.
2. Hammer: A hammer is a candlestick with a long lower wick and a small body. It indicates that the buyers were able to push the price up from a low level, and there may be a trend reversal.
3. Shooting star: A shooting star is a candlestick with a long upper wick and a small body. It indicates that the sellers were able to push the price down from a high level, and there may be a trend reversal.
4. Engulfing pattern: An engulfing pattern is a candlestick pattern where one candle completely engulfs the previous candle. It indicates a possible trend reversal.
In conclusion, candlestick charts are a valuable tool for forex traders. They provide a comprehensive view of price action over a specific period, and they can be used to identify patterns and trends that can provide valuable information about future price movements. By understanding how to read candlestick charts, traders can make informed trading decisions based on price movements.


