Forex trading is a complex process that requires a deep understanding of the market and its trends. To achieve success in this field, traders often rely on various forex indicators to help them make informed decisions. These indicators assist traders in identifying potential trading opportunities by analyzing market data and providing insights into market conditions.

An indicator is a mathematical calculation that is based on the historical price and volume data of a currency pair. These indicators are used to identify trends, patterns, and potential price movements. There are numerous forex indicators available for traders to use, and the number of indicators in an average forex system can vary.
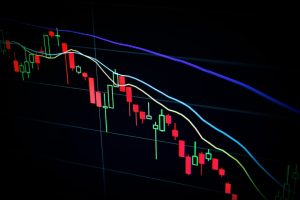
The number of indicators in a forex system depends on the trader’s trading style and strategy. Some traders prefer to use a few select indicators, while others use a combination of several indicators to confirm their trading decisions. The most commonly used forex indicators include Moving Average (MA), Relative Strength Index (RSI), Bollinger Bands, and Stochastic Oscillator.
Moving Average is one of the most popular forex indicators used by traders. It helps traders identify the trend of the market by smoothing out price fluctuations. The MA is calculated by taking the average price of a currency pair over a specific period. Traders use different MA periods, such as 50-day, 100-day, or 200-day, depending on their trading strategy.
The Relative Strength Index (RSI) is another popular forex indicator that measures the strength of a currency pair’s price movement. The RSI is calculated by comparing the average gains and losses of a currency pair over a specific period. Traders use the RSI to identify overbought and oversold conditions, which can indicate potential reversal points in the market.
Bollinger Bands is a forex indicator that helps traders identify price volatility. It consists of three lines – a moving average line and two standard deviation lines. The standard deviation lines are plotted above and below the moving average line and represent the upper and lower price boundaries. Traders use Bollinger Bands to identify potential trading opportunities when the price moves outside the upper or lower boundaries.
The Stochastic Oscillator is a momentum forex indicator that compares the closing price of a currency pair to its price range over a specific period. The Stochastic Oscillator helps traders identify potential trend reversals by indicating overbought and oversold conditions.
Traders can use a combination of these forex indicators or others, depending on their trading style and strategy. The number of indicators in an average forex system can range from one to five or more. Some traders prefer to keep it simple and use only one or two indicators, while others use a combination of several indicators to confirm their trading decisions.
In conclusion, the number of indicators in an average forex system can vary depending on the trader’s trading style and strategy. Traders use forex indicators to identify potential trading opportunities by analyzing market data and providing insights into market conditions. The most commonly used forex indicators include Moving Average (MA), Relative Strength Index (RSI), Bollinger Bands, and Stochastic Oscillator. Traders can use a combination of these indicators or others to make informed trading decisions.