How Graph Forex Can Help Predict Future Currency Trends and Inform Investment Decisions
In the world of foreign exchange trading, accurately predicting future currency trends is crucial to making informed investment decisions. Traders and investors are constantly seeking tools and techniques that can help them gain an edge in the market. One such tool that has gained popularity in recent years is graph forex.
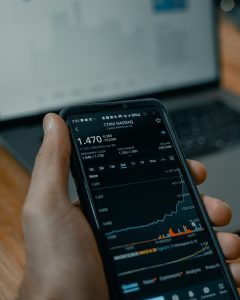
Graph forex, also known as forex chart analysis, is a method of analyzing currency price movements using graphical representations. By plotting currency pairs’ historical price data on a chart, traders can identify patterns, trends, and potential trading opportunities. This form of analysis can provide valuable insights into the market, helping traders make more informed decisions.
One of the key advantages of graph forex is its ability to reveal trends in currency pairs. By examining the historical price movements of a currency pair, traders can identify patterns, such as uptrends, downtrends, or sideways movements. These trends can be indicative of market sentiment and can help traders predict future price movements.
For example, if a currency pair has shown a consistent upward trend over a certain period, it suggests that the market has a bullish sentiment towards that currency. Traders can use this information to make buying decisions, speculating that the trend will continue in the future. Conversely, if a currency pair has been consistently falling, it indicates a bearish sentiment, and traders can consider selling positions.
Graph forex can also help traders identify support and resistance levels, which are crucial in determining entry and exit points. Support levels are price levels where a currency pair has historically found buying pressure, preventing it from falling further. Resistance levels, on the other hand, are price levels where a currency pair has historically faced selling pressure, preventing it from rising further.
By identifying these levels on a chart, traders can determine potential price reversal points. For instance, if a currency pair is approaching a strong resistance level, it suggests that selling pressure may increase, making it an ideal point to exit a long position or enter a short position.
In addition to trends and support/resistance levels, graph forex can also help traders identify chart patterns. Chart patterns are distinct formations that occur on currency price charts and are often indicative of future price movements. Some common chart patterns include triangles, head and shoulders, double tops, and double bottoms.
By recognizing these patterns on a chart, traders can anticipate potential breakouts or reversals. For example, if a currency pair forms a symmetrical triangle pattern, it suggests that a significant price movement is imminent. Traders can position themselves accordingly, taking advantage of the potential breakout.
Furthermore, graph forex can be used in conjunction with various technical indicators to enhance analysis. Technical indicators are mathematical calculations based on price and volume data, providing additional insights into market conditions. Popular technical indicators include moving averages, relative strength index (RSI), and MACD (Moving Average Convergence/Divergence).
By combining the information derived from graph forex with technical indicators, traders can validate their analysis and make more confident investment decisions. For instance, if a currency pair is in an uptrend and the RSI indicates that it is not yet overbought, it provides further confirmation of a potential buying opportunity.
In conclusion, graph forex is a valuable tool for predicting future currency trends and informing investment decisions. By analyzing historical price movements, identifying trends, support/resistance levels, and chart patterns, traders can gain valuable insights into market sentiment and potential price movements. Additionally, by combining graph forex with technical indicators, traders can validate their analysis and make more confident trading decisions. As with any form of analysis, it is important to remember that graph forex is not foolproof and should be used in conjunction with other forms of analysis and risk management strategies.


