Forex trading is one of the most popular investment options in the world. The currency market is highly volatile, and traders need to be well-versed in trading strategies to make informed decisions. One of the essential tools in forex trading is candlestick charts. Candlestick charts are graphical representations of price movements used by traders to identify trends and make predictions.

What are Candlestick Charts?
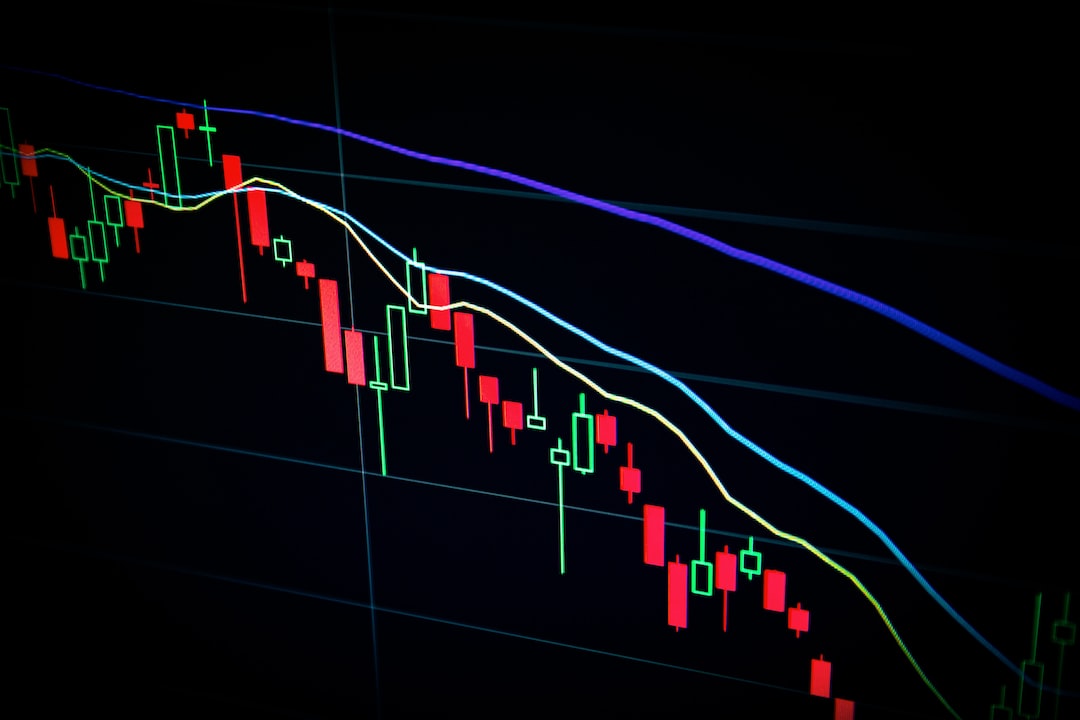
A candlestick chart is a type of financial chart used to represent the price movement of a financial asset such as currency. The chart is made up of individual candles, which represent a specific time period. Each candle has a body and two wicks, one at the top and one at the bottom.
The body of the candle represents the opening and closing prices of the asset, while the wicks represent the high and low prices during the time period. The color of the candle indicates whether the price closed higher or lower than its open.
How to Read Candlestick Charts?
Reading candlestick charts may seem daunting at first, but it is relatively simple once you understand the basics. Here are some important things to look for when reading candlestick charts:
1. Candle Colors
The color of the candle is an essential factor when reading candlestick charts. A green candle represents a bullish trend, which means that the closing price is higher than the opening price. A red candle represents a bearish trend, which means that the closing price is lower than the opening price.
2. Candle Length
The length of the candlestick body represents the price range between the opening and closing prices. A long candlestick indicates a significant price movement, while a short candlestick indicates a minor price movement.
3. Candle Wicks
The wicks, also known as shadows, represent the price range between the high and low prices during the time period. A long wick indicates a high level of volatility, while a short wick indicates low volatility.
4. Candlestick Patterns
Candlestick patterns are a combination of one or more candlesticks that provide insights into market trends. Some common candlestick patterns include the bullish engulfing pattern, bearish engulfing pattern, doji, and hammer.
Bullish engulfing pattern occurs when a small red candle is followed by a larger green candle. This pattern indicates that the bulls have taken control of the market.
Bearish engulfing pattern occurs when a small green candle is followed by a larger red candle. This pattern indicates that the bears have taken control of the market.
A doji is a candlestick with a small body and long wicks. This pattern indicates that the market is indecisive, and traders should exercise caution.
A hammer is a bullish reversal pattern that occurs when a small body and a long wick are at the bottom of the candlestick. This pattern indicates that the bulls have taken control of the market.
Conclusion
Candlestick charts are a powerful tool for forex traders. They provide valuable insights into market trends and can be used to make informed decisions. By understanding the basics of candlestick charts, traders can identify patterns and trends and make better predictions about the future price movements of assets. It is important to remember that candlestick charts are not foolproof, and traders should always exercise caution when making investment decisions.