Forex, or foreign exchange, is a decentralized global market where currencies are traded between individuals, banks, and businesses. It is a highly liquid market that allows traders to profit from fluctuations in currency values. One popular method of technical analysis in Forex is drawing channels. Channels are a visual representation of the trend of a currency pair, and they help traders identify potential entry and exit points. In this article, we will explain how to draw channels in Forex and how to use them in your trading strategy.

What are Channels?
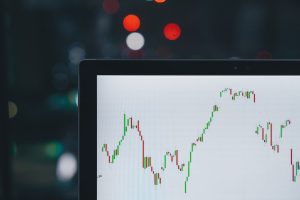
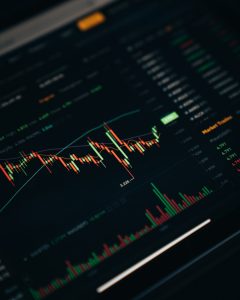
Channels are a visual representation of the trend of a currency pair. They are formed by drawing two parallel lines, one above and one below the price action. The upper line is called the resistance line, and the lower line is called the support line. The resistance line connects the highs of the currency pair, while the support line connects the lows.
There are two types of channels: uptrend channels and downtrend channels. Uptrend channels are formed when the currency pair is in an uptrend, and the price action is moving higher. Downtrend channels are formed when the currency pair is in a downtrend, and the price action is moving lower.
How to Draw Channels in Forex
To draw channels in Forex, you need to follow these steps:
Step 1: Identify the Trend
The first step in drawing channels is to identify the trend of the currency pair. You can use various technical indicators, such as moving averages, to identify the trend. If the price action is above the moving average, the trend is considered bullish, and if it’s below, the trend is considered bearish.
Step 2: Find the Highs and Lows
Once you have identified the trend, the next step is to find the highs and lows of the currency pair. The highs are the points where the price action reaches its highest level, while the lows are the points where the price action reaches its lowest level.
Step 3: Draw the Resistance and Support Lines
After finding the highs and lows, the next step is to draw the resistance and support lines. The resistance line is drawn by connecting the highs of the currency pair, while the support line is drawn by connecting the lows. These lines should be parallel to each other.
Step 4: Adjust the Lines
Once you have drawn the resistance and support lines, you need to adjust them to fit the price action. The lines should touch as many highs or lows as possible, but they should not be forced to fit every single point.
Step 5: Monitor the Channels
After drawing the channels, you need to monitor them to see if the price action continues to follow the trend. If the price action breaks through the resistance or support line, it could be a signal that the trend is changing.
Using Channels in Your Trading Strategy
Channels are a useful tool for traders because they provide a visual representation of the trend of a currency pair. Traders can use channels to identify potential entry and exit points, as well as to set stop-loss and take-profit levels.
One way to use channels in your trading strategy is to look for breakouts. If the price action breaks through the resistance or support line of a channel, it could be a signal that the trend is changing. Traders can enter a long or short position depending on the direction of the breakout.
Another way to use channels in your trading strategy is to set stop-loss and take-profit levels. Traders can set their stop-loss levels below the support line of an uptrend channel or above the resistance line of a downtrend channel. Similarly, traders can set their take-profit levels at the opposite end of the channel.
Conclusion
Drawing channels in Forex is a useful tool for traders to identify the trend of a currency pair and to set entry and exit points. Channels are formed by drawing two parallel lines, one above and one below the price action. The resistance line connects the highs of the currency pair, while the support line connects the lows. Traders can use channels to identify potential breakouts and to set stop-loss and take-profit levels. Channels are just one of many technical indicators that traders can use to analyze the Forex market.