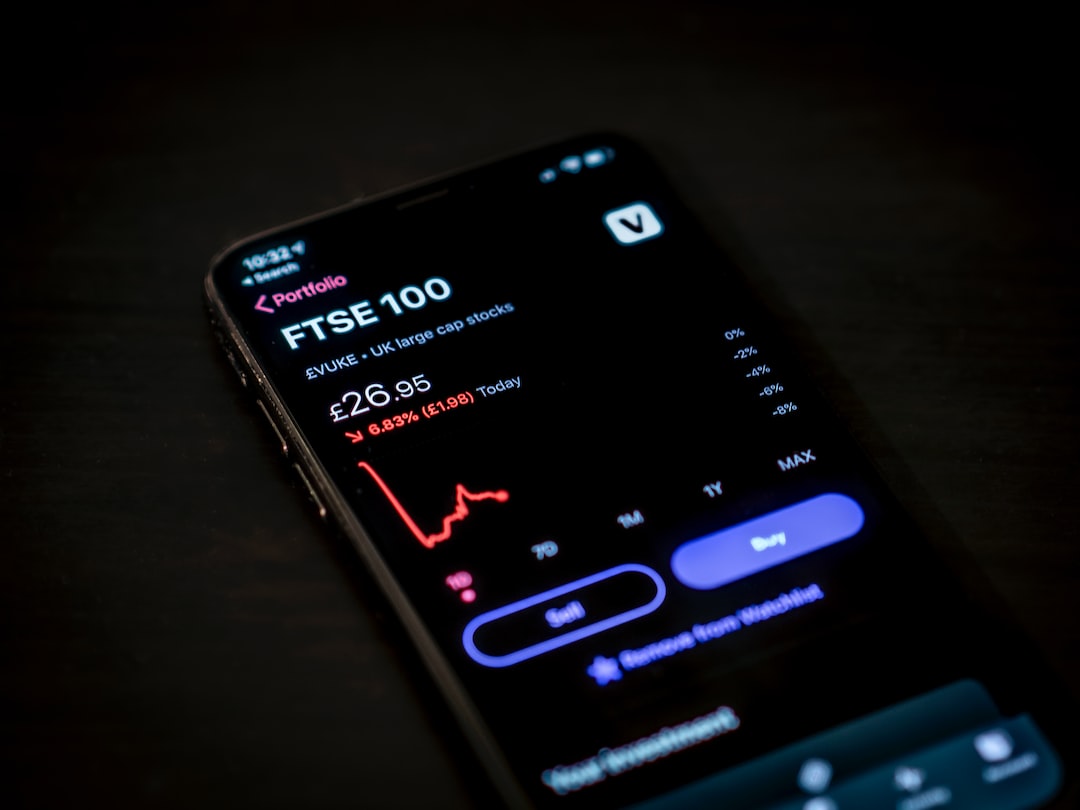
The world of forex trading is vast and complex. Traders who engage in forex trading need to be able to analyze the market trends and patterns to make informed decisions on when to enter or exit a trade. One of the most effective tools for analyzing forex trends is the daily chart.
The daily chart is a graphical representation of the price movements of a particular currency pair over a period of time. It shows the opening and closing prices, as well as the highest and lowest prices of a currency during a 24-hour period. A daily chart is an essential tool for forex traders because it provides a clear picture of the price trends over a longer period, making it easier to identify and predict market movements.
Here are some reasons why a daily chart is a better option for forex traders:
1. Provides a clearer picture of market trends
The daily chart provides a more comprehensive view of the market trends, as compared to shorter time frames. It allows traders to analyze price movements over a more extended period, making it easier to identify and predict market trends. A daily chart provides traders with a better understanding of the market’s overall direction, which helps them make better trading decisions.
2. Reduces noise and false signals
The forex market can be volatile, and price movements can be erratic, especially on shorter time frames. This volatility can lead to false signals, which can cause traders to make poor decisions. A daily chart reduces noise and false signals, providing traders with a clearer picture of the market’s overall direction. By focusing on longer time frames, traders can reduce the impact of market noise and make more accurate trading decisions.
3. Helps traders identify key levels
The daily chart helps traders identify key levels of support and resistance. These levels are significant because they represent areas where price movements are likely to stall or reverse. By identifying these levels, traders can enter or exit trades at the right time, maximizing their profits and minimizing their losses.
4. Provides a better risk-to-reward ratio
The daily chart provides traders with a better risk-to-reward ratio. By focusing on longer time frames, traders can identify high-probability trades with better risk-to-reward ratios. A better risk-to-reward ratio means that traders can make more money on winning trades while minimizing their losses on losing trades.
5. Saves time
Forex trading can be time-consuming, especially for traders who monitor the markets closely. The daily chart allows traders to save time by focusing on longer time frames. Traders can analyze the market trends and patterns on a daily chart and make informed trading decisions without having to monitor the markets constantly.
In conclusion, the daily chart is an essential tool for forex traders. It provides a clearer picture of market trends, reduces noise and false signals, helps traders identify key levels, provides a better risk-to-reward ratio, and saves time. By focusing on longer time frames, traders can make more informed trading decisions, maximizing their profits and minimizing their losses.


