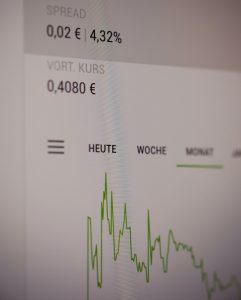
The foreign exchange market, or forex, is a highly volatile and dynamic market where currencies are constantly fluctuating in value. Traders and investors rely on analyzing trends to make informed decisions and maximize profits. However, determining when a forex trend is officially over can be challenging and can have significant implications for traders. In this article, we will explore the various indicators and tools traders use to identify the end of a forex trend.
Firstly, it is important to understand what a trend is in forex. A trend is the general direction in which prices are moving, either upwards (bullish) or downwards (bearish). Trends can be short-term, lasting a few hours or days, or long-term, lasting several months or even years. In forex, trends are identified using technical analysis, which involves analyzing charts and past price movements to identify patterns and trends.
One of the most common tools used to identify trends in forex is the moving average. A moving average is a line on a chart that shows the average price of a currency pair over a specific period, such as 50 days or 200 days. Traders use moving averages to identify the overall direction of a trend. When the price of a currency pair is consistently above the moving average, it is considered a bullish trend, and when it is consistently below, it is considered a bearish trend.
Another tool used to identify the end of a forex trend is the Relative Strength Index (RSI). The RSI is a momentum indicator that measures the strength of a trend by comparing the average gains and losses over a specific period. When the RSI reaches a level of 70 or above, it is considered overbought, indicating that the currency pair may be due for a reversal. Conversely, when the RSI reaches a level of 30 or below, it is considered oversold, indicating that the currency pair may be due for a bounce back.
In addition to technical analysis tools, traders also pay attention to economic indicators and news events that can impact currency values. For example, if a country releases positive economic data, such as strong GDP growth or low unemployment rates, it can boost the value of its currency. Conversely, if a country experiences political instability or a natural disaster, it can cause its currency to weaken.
Traders also pay attention to support and resistance levels when identifying the end of a forex trend. Support levels are areas on a chart where the price of a currency pair has historically bounced back after falling, while resistance levels are areas where the price has historically struggled to break through. When the price of a currency pair breaks through a support or resistance level, it can indicate the end of a trend.
Finally, traders also use fundamental analysis to identify the end of a forex trend. Fundamental analysis involves analyzing economic, financial, and geopolitical factors that can impact currency values. For example, if a central bank announces a change in monetary policy, such as raising interest rates, it can impact the value of the country’s currency. Similarly, if a country experiences a political crisis or a major natural disaster, it can impact the value of its currency.
In conclusion, identifying the end of a forex trend requires a combination of technical and fundamental analysis tools. Traders must pay attention to moving averages, the RSI, support and resistance levels, economic indicators, and news events to make informed decisions. While no single indicator can predict the end of a trend with certainty, a combination of indicators can help traders identify potential reversal points and minimize risk. Ultimately, successful forex trading requires a deep understanding of market trends and a willingness to adapt to changing conditions.


