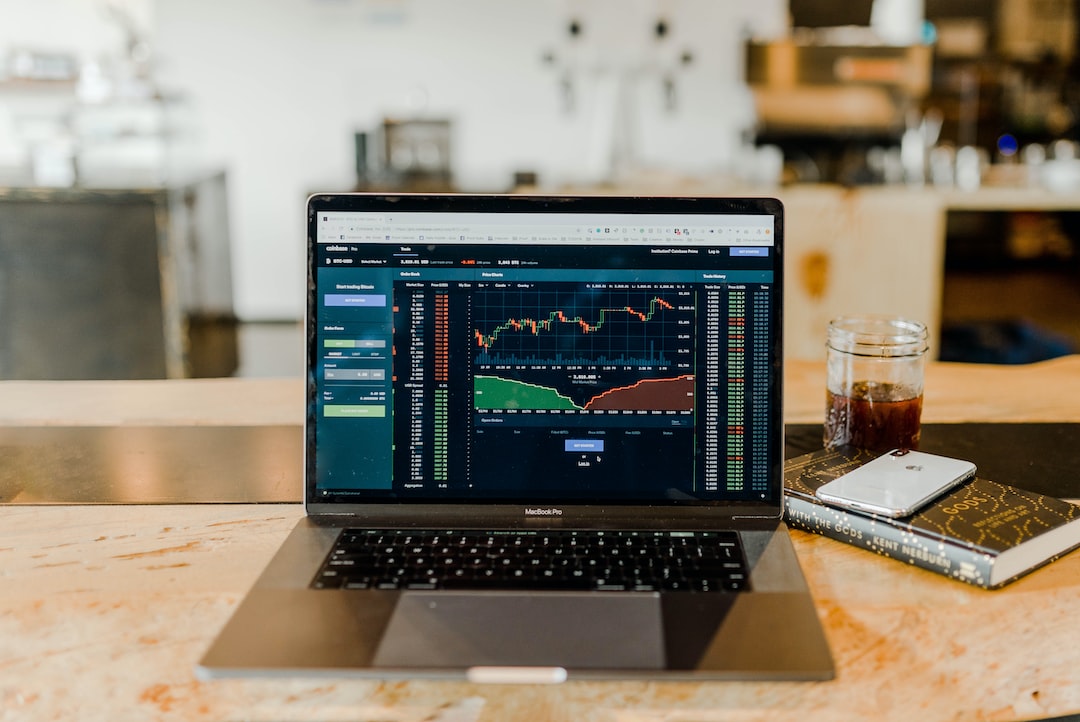
Forex trading is a complex and dynamic market that involves buying and selling different currencies with the aim of making a profit. One of the key factors that traders need to consider when trading in the forex market is the timeframe they use. Timeframes refer to the duration of time that a trader uses to analyze the market and make trading decisions. In the forex market, different traders use different timeframes depending on their trading strategies and goals. However, it is widely believed that big money traders use longer timeframes to make their trading decisions. In this article, we will explore what timeframe chart big money traders use in forex and why.
What is Big Money?
Big money refers to large financial institutions such as banks, hedge funds, and other institutional investors with significant amounts of capital. These players have a massive influence on the forex market due to the large volume of trades they make. For this reason, their trading decisions and strategies can significantly affect the direction of the market. Big money traders have a vast amount of resources at their disposal, such as advanced trading tools, research, and analysis. As a result, they can afford to use more extended timeframes in their trading strategies.
What is a Timeframe Chart?
A timeframe chart is a graphical representation of the price movement of a currency pair over a specific period. Forex traders use different timeframe charts to analyze the market and make trading decisions. The most common timeframe charts used in forex trading are the 1-minute chart, 5-minute chart, 15-minute chart, 30-minute chart, 1-hour chart, 4-hour chart, daily chart, weekly chart, and monthly chart. Each timeframe chart displays the price movement of a currency pair over a particular period, and traders use them to identify trends and patterns in the market.
What Timeframe Chart Does Big Money Use?
Big money traders typically use longer timeframe charts such as the daily, weekly, and monthly charts. These traders have a long-term investment horizon and aim to profit from significant price movements over an extended period. Unlike retail traders who focus on short-term gains, big money traders have the resources to hold their positions for a more extended period, sometimes for months or even years.
The daily chart is the most commonly used timeframe chart by big money traders. This chart displays the price movement of a currency pair over a 24-hour period, providing a more comprehensive view of the market. The daily chart allows traders to identify long-term trends in the market and make informed trading decisions. Big money traders use the daily chart to identify key support and resistance levels, price patterns, and trendlines.
The weekly chart is another timeframe chart used by big money traders. This chart displays the price movement of a currency pair over a week, providing a broader view of the market than the daily chart. The weekly chart is useful for identifying long-term trends and patterns in the market that may not be visible on the daily chart. Big money traders use the weekly chart to confirm their trading decisions based on the daily chart.
The monthly chart is the longest timeframe chart used in forex trading. This chart displays the price movement of a currency pair over a month, providing the most extended view of the market. Big money traders use the monthly chart to identify long-term trends in the market that may not be visible on the daily or weekly chart. The monthly chart is useful for identifying significant price movements in the market and making informed trading decisions.
Why Do Big Money Traders Use Longer Timeframe Charts?
Big money traders use longer timeframe charts because they have a long-term investment horizon. These traders aim to profit from significant price movements over an extended period rather than short-term gains. Longer timeframe charts provide a more comprehensive view of the market and allow traders to identify long-term trends and patterns. Big money traders use longer timeframe charts to make informed trading decisions based on the broader view of the market.
Another reason why big money traders use longer timeframe charts is that they have the resources to hold their positions for a more extended period. These traders have a vast amount of capital at their disposal and can afford to hold their positions for months or even years. Longer timeframe charts provide a more significant opportunity for big money traders to profit from significant price movements in the market.
Conclusion
In conclusion, big money traders use longer timeframe charts such as the daily, weekly, and monthly charts in forex trading. These traders have a long-term investment horizon and aim to profit from significant price movements over an extended period. Longer timeframe charts provide a more comprehensive view of the market and allow traders to identify long-term trends and patterns. Big money traders use longer timeframe charts to make informed trading decisions based on the broader view of the market. Retail traders can also benefit from using longer timeframe charts in their trading strategies to identify long-term trends and make informed trading decisions.


