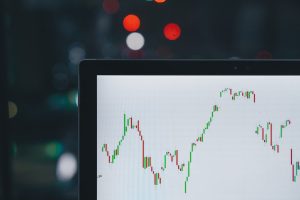
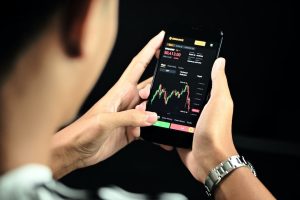
When trading forex, technical analysis is a crucial aspect of making informed trading decisions. Among the various technical tools available to traders, technical indicators are perhaps the most widely used. Technical indicators are mathematical calculations based on a currency pair’s price and/or volume movements that help traders identify potential buy and sell signals. There are numerous indicators available, each with its own strengths and limitations. In this article, we will explore some of the best technical indicators for forex trading and how they can be used to improve trading strategies.
Moving Averages
Moving averages are a popular technical indicator used in forex trading. They are calculated by averaging a currency pair’s price over a set period of time, for example, 10 days or 50 days. Moving averages are used to identify trends and potential trading opportunities. When the price of a currency pair is above the moving average, it is considered an uptrend, and when it is below, it is considered a downtrend. Traders often use moving averages in conjunction with other indicators to confirm potential trade setups.
Relative Strength Index (RSI)
The Relative Strength Index (RSI) is another popular technical indicator used in forex trading. It measures the strength of a currency pair’s price action by comparing the average gains and losses over a set period of time. The RSI is displayed as a number between 0 and 100. When the RSI is above 70, it is considered overbought, and when it is below 30, it is considered oversold. Traders use the RSI to identify potential trend reversals and to confirm potential trade setups.
Bollinger Bands
Bollinger Bands are a technical indicator that measures a currency pair’s volatility. They are displayed as a band around the currency pair’s price and are calculated using a moving average and standard deviation. Bollinger Bands can be used to identify potential breakouts or trend reversals. When the currency pair’s price moves outside the upper or lower band, it is considered a potential trading opportunity. Traders often use Bollinger Bands in conjunction with other indicators to confirm potential trade setups.
Moving Average Convergence Divergence (MACD)
The Moving Average Convergence Divergence (MACD) is a trend-following technical indicator used in forex trading. It is calculated by subtracting a longer-term moving average from a shorter-term moving average. The MACD is displayed as a line and a histogram. When the MACD line crosses above the signal line, it is considered a bullish signal, and when it crosses below, it is considered a bearish signal. Traders use the MACD to identify potential trend reversals and to confirm potential trade setups.
Fibonacci Retracement
Fibonacci Retracement is a technical indicator used in forex trading to identify potential levels of support and resistance. It is calculated by identifying the high and low points of a currency pair’s price and then applying Fibonacci ratios to the price movement. The most commonly used ratios are 38.2%, 50%, and 61.8%. Traders use Fibonacci Retracement to identify potential levels of support and resistance and to confirm potential trade setups.
Conclusion
There are numerous technical indicators available to forex traders, and each has its own strengths and limitations. Moving averages, Relative Strength Index (RSI), Bollinger Bands, Moving Average Convergence Divergence (MACD), and Fibonacci Retracement are some of the best technical indicators for forex trading. Traders often use multiple indicators in conjunction with each other to confirm potential trade setups. It is important to remember that no indicator is foolproof, and traders should always use proper risk management techniques when trading.


