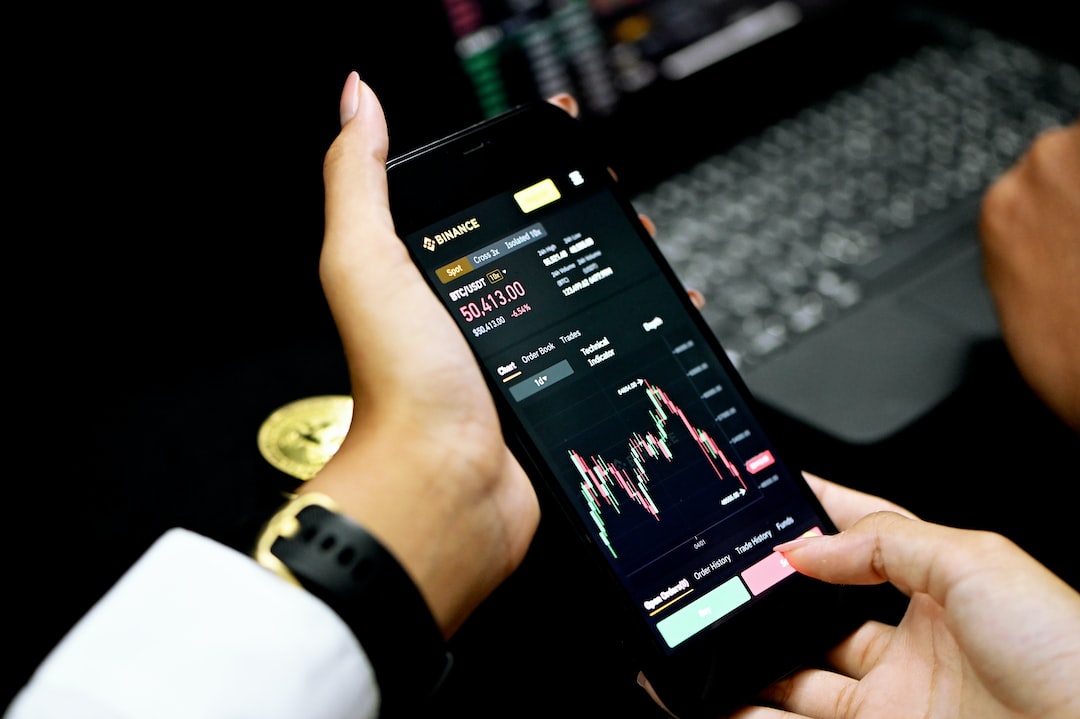
Technical analysis is a trading strategy that uses statistical indicators, charts, and other tools to analyze past market data and predict future price movements. It is a popular approach among forex traders, who use technical analysis to identify profitable trading opportunities and make informed decisions about buying and selling currencies.
At its core, technical analysis is based on the assumption that past price movements reflect future price trends. This is because markets are driven by human emotions, such as fear and greed, which tend to repeat themselves over time. By studying historical price data, traders can identify patterns and trends that may indicate future price movements.
There are many different technical indicators that forex traders use to analyze market data. Some of the most common indicators include moving averages, relative strength index (RSI), Fibonacci retracements, and Bollinger Bands. Each of these indicators provides a different perspective on market trends and can be used to generate buy and sell signals.
Moving averages are one of the simplest and most widely used technical indicators. They are based on the average price of a currency pair over a set period of time, such as 50 days or 200 days. Traders use moving averages to identify trends and determine whether a currency pair is in an uptrend or downtrend.
RSI is another popular indicator that measures the strength of a currency pair’s price movements. It is calculated by comparing the average gains and losses of a currency pair over a set period of time. Traders use RSI to identify overbought and oversold conditions, which can indicate potential reversals in price trends.
Fibonacci retracements are based on the idea that markets tend to retrace a predictable portion of their previous price movements. Traders use Fibonacci retracements to identify potential support and resistance levels, which can help them make decisions about when to enter or exit trades.
Bollinger Bands are another popular indicator that measures the volatility of a currency pair’s price movements. They are based on a moving average and two standard deviations above and below the average. Traders use Bollinger Bands to identify potential breakouts and reversals in price trends.
While technical analysis can be a powerful tool for forex traders, it is important to remember that it is not foolproof. Market conditions can change quickly, and past performance is not always a reliable indicator of future results. Traders must also be mindful of potential false signals and use risk management strategies to protect their capital.
In addition to technical analysis, many forex traders also use fundamental analysis to make informed trading decisions. Fundamental analysis involves analyzing economic and political events that can impact currency prices, such as interest rate changes, inflation, and geopolitical tensions. By combining both technical and fundamental analysis, traders can gain a more comprehensive understanding of market trends and make more informed trading decisions.
In conclusion, technical analysis is a powerful tool for forex traders that can help them identify profitable trading opportunities and make informed decisions about buying and selling currencies. By studying past price movements and using statistical indicators, traders can identify patterns and trends that may indicate future price movements. However, it is important to remember that technical analysis is not foolproof and traders must also be mindful of potential false signals and use risk management strategies to protect their capital.


