Forex trading is a complex and dynamic field that requires a solid understanding of the market’s fundamentals and technical analysis. One of the critical aspects of forex trading is the use of different indicators to forecast the market’s direction and identify potential trading opportunities. One such indicator is the M30, which is commonly used by forex traders to analyze the market’s trend and momentum.

What is M30 in Forex?
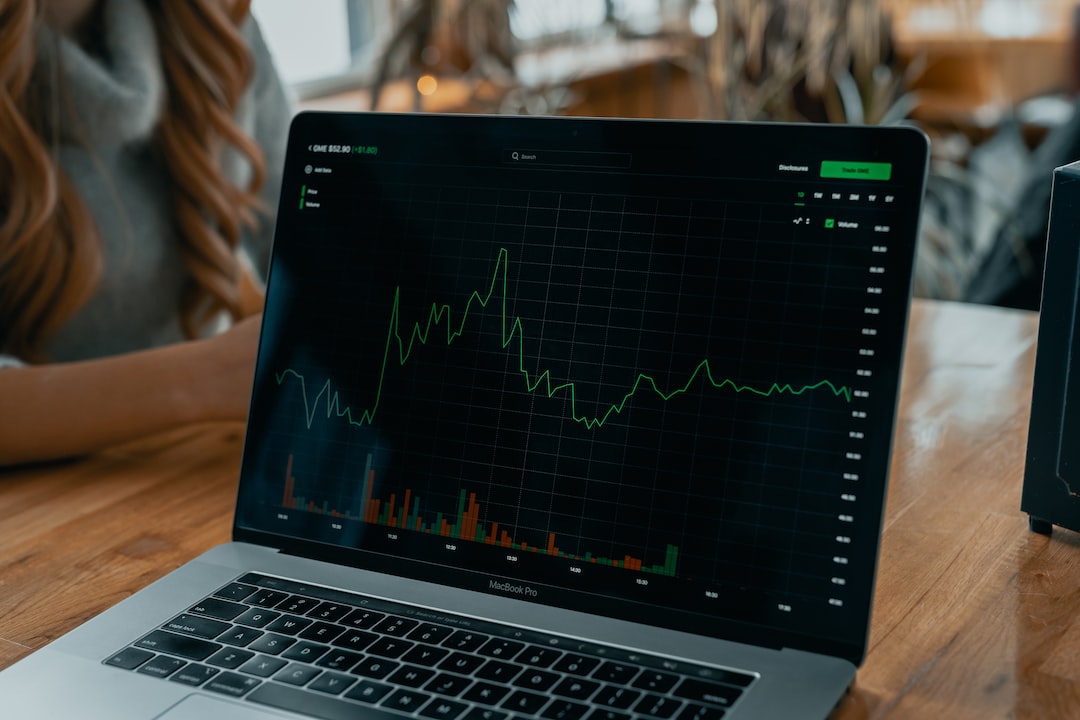
M30 refers to the 30-minute time frame chart, which is a popular chart used in forex trading. It is a time frame chart that shows the price movement of a currency pair over a 30-minute period. Each candlestick on the M30 chart represents 30 minutes of trading activity, allowing traders to analyze short-term price movements in the market.
The M30 chart is a middle ground between the shorter-term and longer-term charts. It provides traders with a more in-depth view of the market than the shorter-term charts, such as the M1, M5, or M15 charts, but it is less volatile than the longer-term charts, such as the H1, H4, or daily charts.
How to Use M30 in Forex Trading?
M30 is an essential chart for forex traders as it helps them to identify the market’s trend and momentum. Here are some ways traders use M30 in forex trading:
1. Trend Analysis: The M30 chart is useful for analyzing the market’s short-term trend. By looking at the chart patterns and candlestick formations, traders can identify if the market is trending up, down, or sideways. This information is crucial for making trading decisions, such as entering or exiting trades.
2. Momentum Analysis: Momentum is another critical aspect of forex trading. The M30 chart helps traders to identify the market’s momentum by analyzing the speed and strength of the price movement. Traders can use momentum indicators, such as the Moving Average Convergence Divergence (MACD) or the Relative Strength Index (RSI), to confirm the momentum.
3. Entry and Exit Points: The M30 chart is also useful for identifying entry and exit points for trades. By analyzing the chart patterns and candlestick formations, traders can identify potential trading opportunities and set up their entry and exit points accordingly.
4. Risk Management: Risk management is a crucial aspect of forex trading. The M30 chart helps traders to identify the market’s volatility and set up their stop-loss and take-profit levels accordingly.
Conclusion
The M30 chart is an essential tool for forex traders as it provides them with a more in-depth view of the market’s short-term trend and momentum. By analyzing the chart patterns and candlestick formations on the M30 chart, traders can identify potential trading opportunities and set up their entry and exit points accordingly. It is always advisable to use the M30 chart alongside other charts and indicators to confirm the trading signals and make informed trading decisions.