Forex, also known as foreign exchange or currency trading, is a decentralized global market where all the world’s currencies are traded. The forex market is the largest financial market in the world, with an average daily turnover of over $5 trillion. Forex trading is done electronically over-the-counter (OTC), which means that trades are conducted via computer networks between traders around the world, rather than on a centralized exchange like the New York Stock Exchange.
One of the key aspects of forex trading is understanding the concept of currency pairs. A currency pair is the quotation of two different currencies, with the value of one currency being quoted against the value of another currency. For example, the EUR/USD currency pair represents the euro (EUR) being quoted against the US dollar (USD). Traders buy and sell currency pairs based on their predictions of how the exchange rate between the two currencies will change in the future.
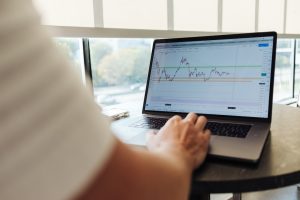
To better understand forex trading, it can be helpful to look at some visual representations of the market. One common way to visualize the forex market is through candlestick charts. Candlestick charts display the price movements of a currency pair over a certain period of time, such as a day, a week, or a month. Each candlestick represents a specific time period, and the body of the candlestick represents the opening and closing prices of the currency pair during that time period. The wicks or shadows of the candlestick represent the highest and lowest prices reached during that time period.
Another way to visualize the forex market is through line charts. Line charts display the price movements of a currency pair over time as a continuous line. This type of chart is useful for identifying longer-term trends in the market.
In addition to charts, traders also use technical indicators to help them make trading decisions. Technical indicators are mathematical calculations based on the price and/or volume of a currency pair that can help traders identify trends and potential entry and exit points. Some common technical indicators used in forex trading include moving averages, relative strength index (RSI), and Bollinger Bands.
Fundamental analysis is another important aspect of forex trading. Fundamental analysis involves analyzing economic and political events that can affect the value of currencies. For example, if the Federal Reserve announces an interest rate hike, this could cause the US dollar to strengthen against other currencies. Traders who use fundamental analysis will keep track of economic indicators such as GDP, inflation, and employment data to help them make trading decisions.
In conclusion, forex trading is a complex and dynamic market that can be difficult to understand at first. However, visual representations such as candlestick charts and technical indicators can help traders identify trends and potential entry and exit points. Fundamental analysis is also important for understanding the underlying economic and political factors that can affect currency values. With the right knowledge and tools, forex trading can be a lucrative and exciting way to invest in the global economy.