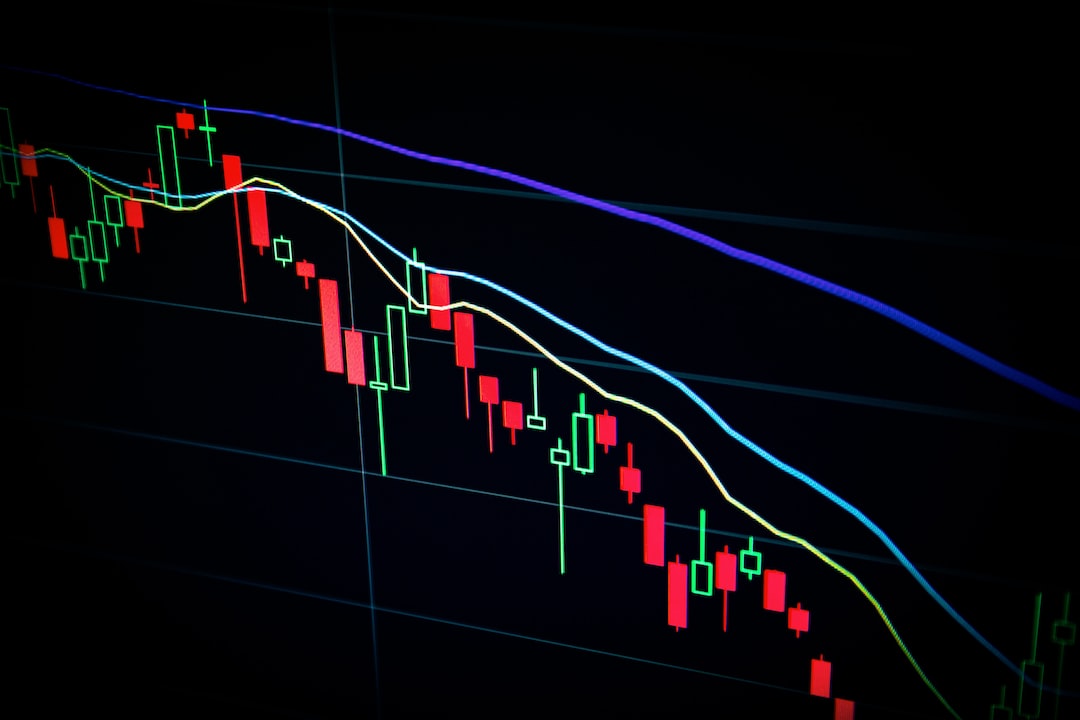
Forex trading is an exciting yet complex financial market where traders attempt to capitalize on the movements of currency pairs. To help make sense of the market movements, traders use various tools and strategies to identify potential opportunities. One such tool is a trendline.
In forex trading, a trendline is a straight line that connects two or more price points on a chart. The line represents the direction and strength of the market trend. It is used to identify the current trend and to make predictions about future price movements.
Trendlines are commonly used by technical analysts to help them identify trading opportunities. Technical analysis is the study of past market data, primarily price and volume, to identify patterns and trends that can help predict future market movements.
When a trendline is drawn on a forex chart, it can help identify the direction of the trend. If the trendline is sloping upwards, it indicates an uptrend, and if it is sloping downwards, it indicates a downtrend. A horizontal trendline indicates a sideways trend.
Traders use trendlines to help them identify key levels of support and resistance. Support is a price level where buying pressure is strong enough to prevent the price from falling further. Resistance is a price level where selling pressure is strong enough to prevent the price from rising further. By connecting the key levels of support and resistance with a trendline, traders can identify potential trade setups.
There are two types of trendlines that traders commonly use – uptrend lines and downtrend lines. An uptrend line is drawn by connecting two or more low points on a chart, with the line sloping upwards. A downtrend line is drawn by connecting two or more high points on a chart, with the line sloping downwards.
Traders also use trendlines to help them identify potential trend reversals. A trend reversal occurs when the market trend changes direction. By monitoring the trendline, traders can identify when the trend is weakening, and a reversal may be imminent.
It is important to note that trendlines are not always accurate indicators of future market movements. Like all technical analysis tools, they are based on past market data, and there is no guarantee that the market will continue to follow the same pattern in the future.
Traders should also be aware of false breakouts, where the price breaks through a trendline but then quickly reverses back in the opposite direction. To avoid false breakouts, traders should wait for confirmation of a trend reversal before entering a trade.
In conclusion, trendlines are an essential tool for forex traders. They help identify the direction and strength of the market trend, potential trade setups, and key levels of support and resistance. However, traders should use trendlines in conjunction with other technical analysis tools and fundamental analysis to make informed trading decisions. By combining different tools and strategies, traders can increase their chances of success in the forex market.


