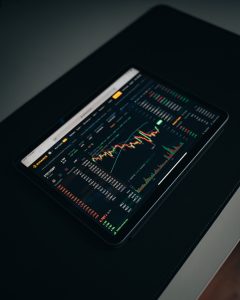
Candlestick charts have become a popular way of representing price movements in the financial markets, including the forex market. Candlesticks provide traders with a lot of information about price movements, including the opening and closing prices of a currency pair, the high and low prices of a currency pair, and the market sentiment.
In forex trading, candlesticks are used to represent the price action of a currency pair over a specified time period. Each candlestick is made up of a body and two wicks, or shadows. The body represents the opening and closing prices of a currency pair, while the wicks represent the high and low prices of the currency pair during the specified time period.
Candlestick charts are used to identify trends and potential reversal points in the forex market. A bullish candlestick pattern indicates that the price of the currency pair is likely to rise, while a bearish candlestick pattern indicates that the price of the currency pair is likely to fall.
There are several types of candlestick patterns that forex traders use to identify potential trading opportunities. The most common candlestick patterns include the doji, hammer, shooting star, and engulfing pattern.
The doji pattern is formed when the opening and closing prices of a currency pair are the same. This pattern indicates indecision in the market, and can be a signal of a potential reversal.
The hammer pattern is formed when the price of a currency pair falls during the trading day, but then recovers and closes near the opening price. This pattern indicates that buyers have entered the market and are likely to push the price of the currency pair higher.
The shooting star pattern is the opposite of the hammer pattern. It is formed when the price of a currency pair rises during the trading day, but then falls and closes near the opening price. This pattern indicates that sellers have entered the market and are likely to push the price of the currency pair lower.
The engulfing pattern is formed when a bearish candlestick is followed by a bullish candlestick, or when a bullish candlestick is followed by a bearish candlestick. This pattern indicates a potential reversal in the market.
Candlestick charts also provide traders with information about the market sentiment. If a candlestick has a long wick or shadow, it indicates that the price of the currency pair has moved significantly during the trading day, but then retraced back to the opening price. This can indicate that traders are indecisive about the direction of the market.
In summary, candlestick charts are an important tool for forex traders. They provide traders with information about the opening and closing prices of a currency pair, the high and low prices of a currency pair, and the market sentiment. By using candlestick patterns, traders can identify potential trading opportunities and potential reversal points in the market.


