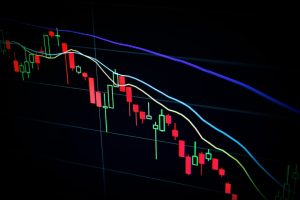
Forex indicators are an essential tool for traders to interpret and predict market trends. Indicators are mathematical calculations that use historical price and volume data to provide insights into future price movements. There are various forex indicators available, but which ones are the best for traders?
1. Moving Averages
Moving averages are one of the most popular indicators used in forex trading. They smooth out price movements and provide a clear view of the overall trend. A moving average is calculated by adding up the prices of the chosen time period and then dividing by the number of periods. A popular choice is the 20-period moving average.
Traders use moving averages to identify trends and determine entry and exit points. When the price is above the moving average, it is considered bullish, and when it is below the moving average, it is considered bearish.
2. Relative Strength Index (RSI)
The Relative Strength Index (RSI) is a momentum indicator that measures the speed and change of price movements. It is calculated using the average gains and losses over a specified time period, usually 14 days. The RSI ranges from 0 to 100, with readings above 70 indicating overbought conditions, and readings below 30 indicating oversold conditions.
Traders use the RSI to identify potential reversal points in the market. When the RSI is in overbought territory, it suggests that the market is due for a pullback, while oversold conditions suggest that the market is due for a bounce.
3. Fibonacci Retracement
Fibonacci retracement is a popular tool used by traders to identify potential support and resistance levels. It is based on the idea that markets tend to retrace a predictable portion of a move after a significant price swing.
The retracement levels are drawn using the Fibonacci sequence, which is a series of numbers where each number is the sum of the two preceding numbers. The retracement levels are 23.6%, 38.2%, 50%, 61.8%, and 78.6%.
Traders use Fibonacci retracement levels to identify potential entry and exit points. When the price is approaching a retracement level, it suggests that the market may reverse direction.
4. Bollinger Bands
Bollinger Bands are a volatility indicator that measures the price’s standard deviation over a specified time period. The bands consist of three lines: the middle band, which is a moving average, and two outer bands, which are two standard deviations away from the middle band.
Traders use Bollinger Bands to identify potential breakouts and reversals. When the price is touching the upper band, it suggests that the market is overbought, while touching the lower band suggests that the market is oversold.
5. MACD
The Moving Average Convergence Divergence (MACD) is a momentum indicator that measures the difference between two moving averages. The MACD is calculated by subtracting the 26-period exponential moving average from the 12-period exponential moving average.
Traders use the MACD to identify potential trend changes and momentum shifts. When the MACD line crosses above the signal line, it suggests that the market is turning bullish, while crossing below the signal line suggests that the market is turning bearish.
Conclusion
In conclusion, there are various forex indicators available to traders, but the best ones depend on the trader’s trading style and strategy. Moving averages, RSI, Fibonacci retracement, Bollinger Bands, and MACD are some of the most popular indicators used by traders.
It is essential to remember that no indicator is perfect, and traders should use multiple indicators to confirm their trading decisions. Traders should also understand the limitations of each indicator and use them in conjunction with other analysis tools to make informed trading decisions.


