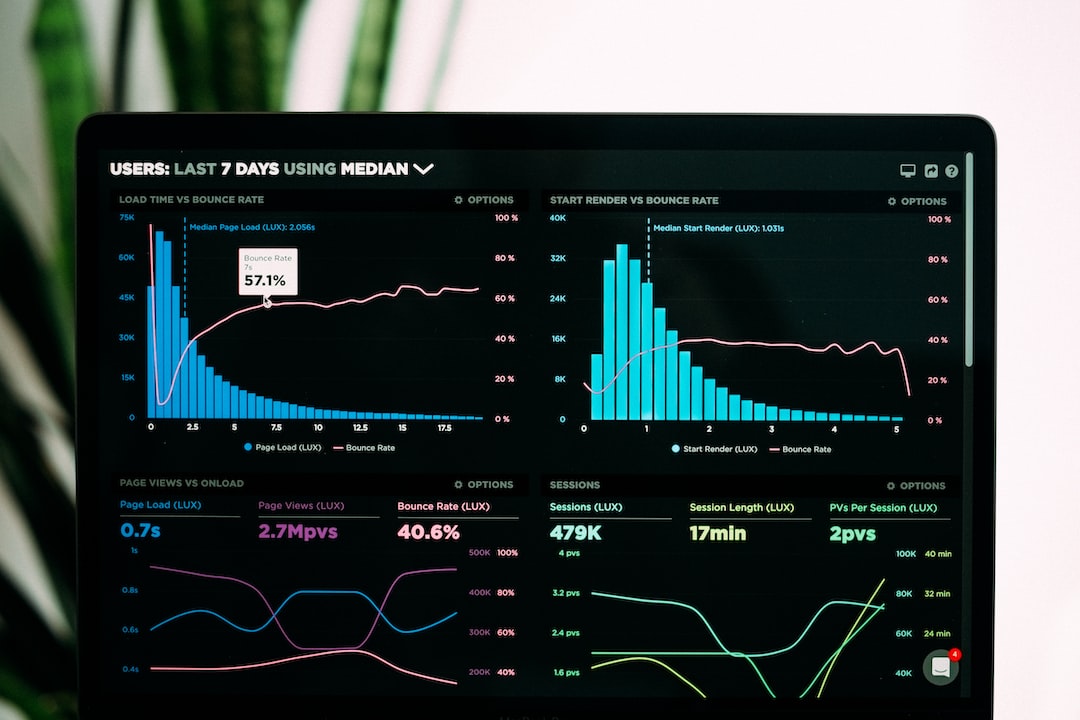
Technical indicators in forex are tools that are used by traders to analyze and interpret the price movements of currency pairs in the foreign exchange market. They are mathematical calculations that are based on the price and/or volume of a currency pair, and they are used to identify trends, confirm price movements, and predict future price movements.
There are many different types of technical indicators that traders use in forex, but some of the most popular ones include moving averages, relative strength index (RSI), stochastic oscillator, and MACD (Moving Average Convergence Divergence) indicator. Each of these indicators has its own unique formula and is used to analyze different aspects of price movements.
Moving averages are one of the simplest and most commonly used technical indicators in forex. They are used to smooth out price movements over a certain period of time, and they help traders identify trends. A moving average is calculated by taking the average price of a currency pair over a certain period of time, such as 20 days or 50 days.
The relative strength index (RSI) is another popular technical indicator in forex. It is used to identify overbought and oversold conditions in a currency pair. The RSI compares the average gain and loss over a certain period of time and plots the result on a scale of 0 to 100. When the RSI is above 70, it is considered overbought, and when it is below 30, it is considered oversold.
The stochastic oscillator is another technical indicator that is used to identify overbought and oversold conditions in a currency pair. It is similar to the RSI, but it is based on the idea that prices tend to close near the high or low of the price range over a certain period of time. The stochastic oscillator plots the difference between the current price and the lowest low over a certain period of time, and it ranges from 0 to 100.
The MACD indicator is a more complex technical indicator that is used to identify trends and confirm price movements. It is calculated by subtracting the 26-day exponential moving average (EMA) from the 12-day EMA, and then plotting a 9-day EMA on top of the MACD line. The MACD line is used to identify changes in momentum, while the signal line (9-day EMA) is used to confirm the trend.
In addition to these popular technical indicators, there are many other indicators that traders use to analyze and interpret price movements in forex. Some of these include Bollinger Bands, Fibonacci retracement levels, and Ichimoku Kinko Hyo.
Overall, technical indicators are an essential tool for forex traders. They help traders identify trends, confirm price movements, and predict future price movements. While no technical indicator is perfect, they can provide valuable insights into the market and help traders make more informed trading decisions.


