Understanding Technical Analysis in Futures Forex Trading
Technical analysis is a popular method used by traders in the forex market to analyze past price data and predict future price movements. It is based on the belief that historical price patterns can provide valuable insights into the direction of future price movements.

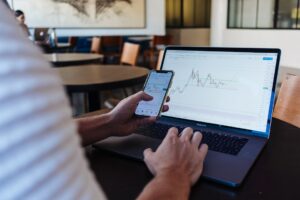
In futures forex trading, technical analysis plays a crucial role in helping traders make informed trading decisions. By studying charts and using various technical indicators, traders can identify potential entry and exit points for their trades. In this article, we will explore the key aspects of technical analysis in futures forex trading.
1. Price Charts:
Price charts are the foundation of technical analysis. They provide a visual representation of historical price movements over a specific time period. Traders use different types of charts, such as line charts, bar charts, and candlestick charts, to analyze price patterns and trends. These charts help traders identify support and resistance levels, trend lines, and chart patterns, which are essential for making trading decisions.
2. Trend Analysis:
Trend analysis is a key component of technical analysis. Traders use trend lines to identify the direction of the market. An uptrend is characterized by higher highs and higher lows, while a downtrend is characterized by lower highs and lower lows. By identifying the prevailing trend, traders can align their trades with the overall market direction, increasing their chances of making profitable trades.
3. Support and Resistance Levels:
Support and resistance levels are areas on a price chart where the price tends to bounce back or reverse. Support levels are areas where buying pressure is strong enough to prevent the price from falling further, while resistance levels are areas where selling pressure is strong enough to prevent the price from rising further. Traders use these levels to identify potential entry and exit points for their trades. When the price breaks above a resistance level, it becomes a new support level, and vice versa.
4. Chart Patterns:
Chart patterns are specific formations that occur on price charts and provide valuable information about future price movements. Common chart patterns include head and shoulders, double tops and bottoms, triangles, and flags. These patterns indicate potential trend reversals or continuations, and traders use them to identify trading opportunities. By combining chart patterns with other technical indicators, traders can increase the accuracy of their trading signals.
5. Technical Indicators:
Technical indicators are mathematical calculations based on price and volume data. They help traders confirm trends, identify overbought or oversold conditions, and generate trading signals. Some popular technical indicators used in futures forex trading include moving averages, relative strength index (RSI), stochastic oscillator, and MACD (Moving Average Convergence Divergence). Traders often combine multiple indicators to get a more comprehensive view of the market.
6. Fibonacci Retracement:
Fibonacci retracement is a technical analysis tool that traders use to identify potential support and resistance levels based on the Fibonacci sequence. The Fibonacci retracement levels are calculated by drawing horizontal lines at key Fibonacci ratios (23.6%, 38.2%, 50%, 61.8%, and 78.6%) on a price chart. These levels often coincide with support and resistance levels, and traders use them to determine potential entry and exit points for their trades.
In conclusion, technical analysis is a powerful tool that helps traders in futures forex trading make informed trading decisions. By studying price charts, identifying trends, recognizing support and resistance levels, analyzing chart patterns, using technical indicators, and applying Fibonacci retracement, traders can gain valuable insights into the market and improve their trading performance. However, it is important to note that technical analysis is not foolproof and should be used in conjunction with other forms of analysis and risk management strategies to maximize trading success.