Understanding Forex Trading Charts: A Beginner’s Guide
Forex trading, also known as foreign exchange trading, is the buying and selling of currencies on the global forex market. It is a decentralized market where currencies are traded 24 hours a day, five days a week. To be successful in forex trading, it is essential to have a solid understanding of forex trading charts. These charts provide crucial information about currency price movements and help traders make informed decisions.

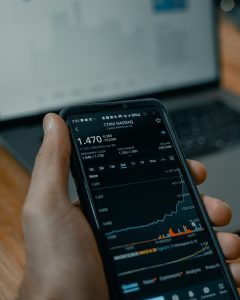
Forex trading charts are graphical representations of currency price movements over a specific period. They display the opening, closing, high, and low prices of currencies in the form of candlesticks, bars, or lines. These charts are an essential tool for technical analysis, which involves studying past price movements to predict future price movements.
There are several types of forex trading charts, including line charts, bar charts, and candlestick charts. Line charts are the simplest form, displaying a line that connects the closing prices of each period. Bar charts provide more detailed information by showing the opening, closing, high, and low prices of each period in the form of bars. Candlestick charts, on the other hand, are the most commonly used charts in forex trading. They provide the same information as bar charts but in a more visually appealing way.
Candlestick charts consist of individual candlesticks, each representing a specific time period, such as one minute, one hour, or one day. These candlesticks have two main components: the body and the wick. The body represents the opening and closing prices, while the wick represents the high and low prices during that period.
Understanding the different candlestick patterns is crucial for interpreting forex trading charts. Some common candlestick patterns include doji, engulfing, hammer, and shooting star. Each pattern provides valuable information about market sentiment and potential price reversals. For example, a doji candlestick, which has a small body and long wicks, indicates indecision in the market. It suggests that neither the buyers nor the sellers have control, and a trend reversal may be imminent.
In addition to candlestick patterns, forex traders also use various technical indicators to analyze price movements. These indicators help identify trends, support and resistance levels, and potential entry and exit points. Some popular technical indicators include moving averages, relative strength index (RSI), and Bollinger Bands. These indicators can be superimposed on forex trading charts to provide additional insights into market conditions.
One of the key advantages of forex trading charts is their ability to display multiple timeframes. Traders can analyze price movements on various timeframes simultaneously to gain a comprehensive understanding of the market. For example, a trader may use a daily chart to identify the overall trend and a one-hour chart to pinpoint the entry and exit points.
To effectively interpret forex trading charts, it is essential to understand the concept of support and resistance levels. Support levels are price levels where buying pressure outweighs selling pressure, causing prices to bounce back up. Resistance levels, on the other hand, are price levels where selling pressure outweighs buying pressure, causing prices to reverse downward. These levels can be identified by analyzing previous price movements and are crucial for setting stop-loss and take-profit levels.
In conclusion, understanding forex trading charts is essential for anyone venturing into the world of forex trading. These charts provide valuable information about currency price movements and help traders make informed decisions. By studying candlestick patterns, technical indicators, and support and resistance levels, traders can gain a comprehensive understanding of the market and increase their chances of success. So, whether you are a beginner or an experienced trader, mastering the art of reading forex trading charts is a crucial step towards becoming a successful forex trader.