The harmonic volatility indicator is the first technical analysis to be applied in Fibonacci’s analysis of financial volatility. The Harmonic Volatility Indicator is another trading tool that acts at the price action level, combining robust Fibonacci relationships at different levels (0.618, 0.382, etc.) with market volatility. Initially, the Harmonic Volatility Indicator was developed to overcome the limitation and weakness of Gann’s Angle, also known as Gann’s Fan.
Overview
It has been shown that the Harmonic Volatility Indicator can be applied similarly to the Gann Angle (or Gann Fan) in your charts. At the same time, since volatility is very important information for traders, the indicator of harmonic volatility can also bring many other benefits to all traders. The Harmonic Volatility Indicator can either be incorporated into your current technical analysis, or you can use it as a complement to the totally independent technical analysis for your trading. It is also very effective at detecting mature trends in its final phase. You can use this powerful tool to identify significant levels of support and resistance, trend reversal points, and trend forces.
Configuration of Operations
As long as you understand the principle of basic trading, you can expand your trading with different ideas using the indicator of harmonic volatility. Let us speak here of four examples:
Possible Trading Configuration 1 – Harmonic Volatility Indicator as Trading Zone (Investment and Breakout Trading Configuration)
Possible trading configuration 2 – Harmonic volatility indicator and common oscillators (trading investment settings)
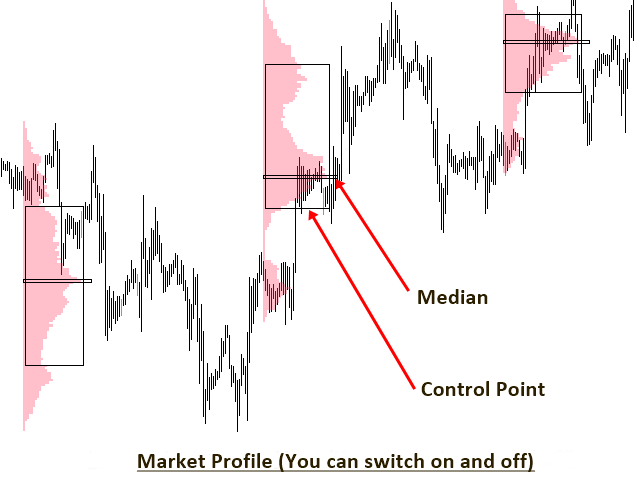
Possible Trading Configuration 3 – Harmonic Volatility Indicator and Market Profile (Trading Investment Styles and Possible Trading with Breakout Mode)
Possible Trading Settings 4 – Harmonic Volatility Indicator and Harmonic Pattern Plus and Market Profile (Trading Investment Settings)
Indicator Settings
The following entries control the overall configuration of the indicator.
Daily session number: 0 means that the indicator will not draw any daily volatility line. 1 means that the indicator will draw a set of daily volatility lines. You can create several sessions of daily volatility lines. However, too many sessions can slow down your Metatrader. So you better use the right number for your computer.
Weekly session number: It is configured in the same way as the daily session entry.
Monthly Session Number: It is configured in the same way as the daily session entry.
Start index: 0 is the default value. For 0, the indicator will start drawing from session 0.
Using White Chart: True means you will use a white background chart.
Color of the daily line: Color of the daily line.
Weekly line color: Weekly line color.
Monthly line color: Monthly line color.
Show probability lines: Turn on and off the curve probability line.
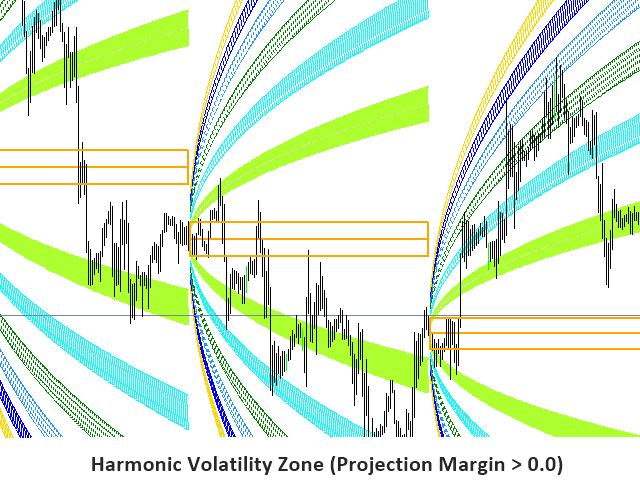
Show final projection: Turn on and off the trading zone box.
Final projection margin: Box size.
Service Cost
You have a free trial version to evaluate it, and you can also rent it for $25 a month. If you want the full version, you can also buy it for 70 USD. You can buy the indicator in the MQL market in the indicators section.
Conclusion
In summary, we talk about an indicator with some complexity, which will be more suitable for those traders who understand harmonic patterns. This indicator was created in April 2018, and although it has little criticism from its users, they are quite positive, so if you are interested in a harmonic pattern indicator, this may be the right one.