Mastering Technical Analysis: How to Use Charts and Indicators for Profitable Forex Trading
Technical analysis is an essential tool for forex traders. By analyzing historical price data and using charts and indicators, traders can identify patterns, trends, and potential trading opportunities. Understanding how to use charts and indicators effectively can significantly improve your trading skills and increase your chances of making profitable trades in the forex market.

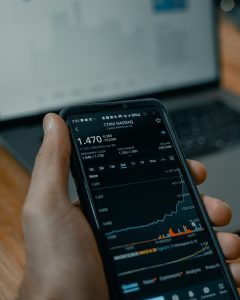
Charts are the foundation of technical analysis. They visually represent the price movements of a currency pair over a specific period. Different types of charts are available, including line charts, bar charts, and candlestick charts. Candlestick charts are the most popular among forex traders due to their ability to provide detailed information about price movements.
Candlestick charts consist of individual candles that represent a specific time period, such as one minute, one hour, or one day. Each candle has a body and two wicks, also known as shadows. The body represents the opening and closing prices, while the wicks represent the highest and lowest prices reached during that time period.
Using candlestick patterns can help traders predict future price movements. Some common patterns include doji, hammer, shooting star, engulfing, and harami. For example, a doji pattern indicates indecision in the market, while a hammer pattern suggests a potential reversal. By recognizing these patterns on the charts, traders can make informed trading decisions.
Indicators are another vital tool used in technical analysis. They are mathematical calculations that are applied to price data to generate trading signals. There are various types of indicators, including trend-following indicators, oscillators, and volume-based indicators.
Trend-following indicators are used to identify the direction of the market trend. Moving averages, such as the simple moving average (SMA) and the exponential moving average (EMA), are commonly used trend-following indicators. They smooth out price fluctuations and provide a clear picture of the overall trend. Traders look for crossovers between different moving averages or the price crossing above or below a moving average as potential entry or exit signals.
Oscillators are used to identify overbought or oversold conditions in the market. The Relative Strength Index (RSI) and the Stochastic Oscillator are popular oscillators. The RSI measures the strength and speed of a price movement, while the Stochastic Oscillator compares the closing price to the price range over a specific period. When an oscillator reaches extreme levels, it suggests a potential reversal or correction in the market.
Volume-based indicators analyze the trading volume accompanying price movements. The On-Balance Volume (OBV) indicator, for example, compares the volume on up days to the volume on down days. If the OBV is rising, it indicates that buying pressure is increasing, which may suggest further price appreciation.
To master technical analysis, it is important to understand that charts and indicators should not be used in isolation. Traders should consider multiple factors and use a combination of different tools to confirm their trading decisions. For example, if a candlestick pattern suggests a reversal, traders can look for confirmation from an oscillator or a trend-following indicator.
It is also crucial to consider the time frame you are trading on. Different charts and indicators may provide different signals depending on the time frame. Short-term traders may focus on shorter time frames, such as 5-minute or 15-minute charts, while long-term traders may prefer daily or weekly charts.
Lastly, it is essential to practice and backtest your trading strategies using historical data before applying them in real-time trading. This allows you to assess the effectiveness of your strategies and make necessary adjustments.
In conclusion, mastering technical analysis is key for profitable forex trading. By understanding how to use charts and indicators effectively, traders can identify patterns, trends, and potential trading opportunities. Charts provide visual representations of price movements, while indicators generate trading signals. However, it is important to consider multiple factors and use a combination of tools to confirm trading decisions. With practice and backtesting, traders can improve their technical analysis skills and increase their chances of success in the forex market.