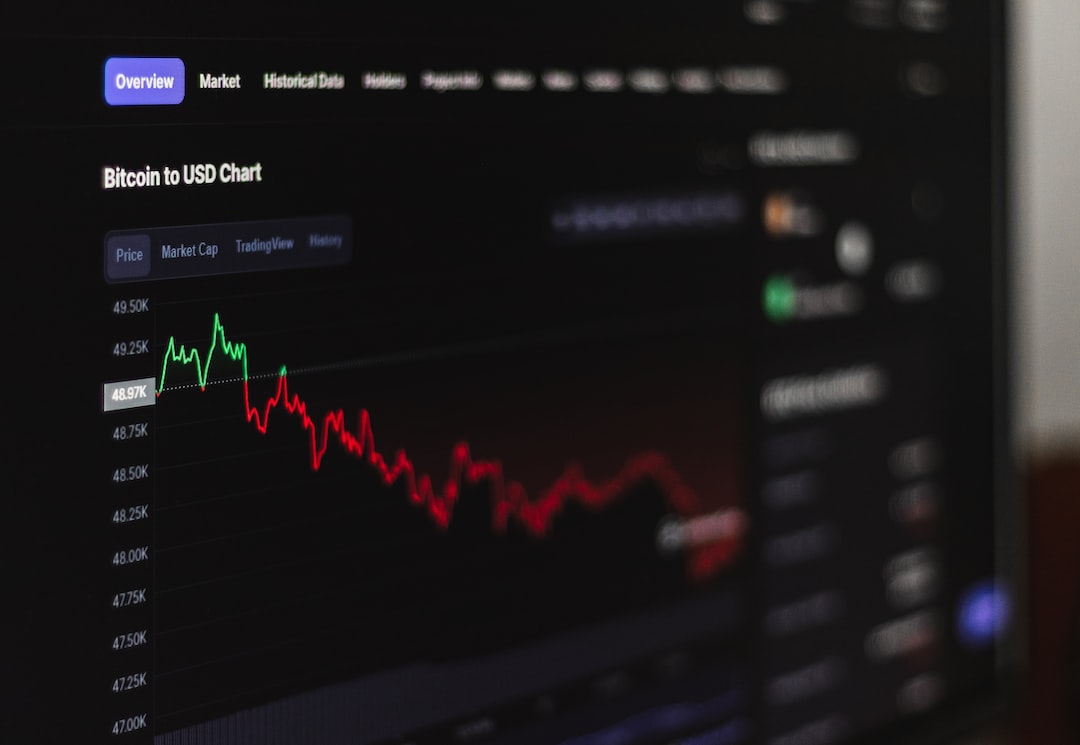
Foreign exchange (forex) trading is a lucrative undertaking that involves buying and selling currencies in order to make a profit. However, forex trading can be complex and requires a deep understanding of various factors that can affect the value of currencies. One of the most important tools for forex traders is the forex chart. Forex charts are graphical representations of the price movements of currency pairs over time. In this article, we will discuss how to read forex charts and interpret the information they provide.
Understanding the Basics of Forex Charts
Forex charts are used to display the price movement of currency pairs over time. This is done by plotting the price of the currency on the y-axis and the time period on the x-axis. There are different types of forex charts, but the most commonly used are line charts, bar charts, and candlestick charts.
Line charts are the simplest type of forex chart. They display the price movement of a currency pair over time by connecting the closing prices of each period with a straight line. Line charts are useful for identifying long-term trends in the forex market.
Bar charts are more complex than line charts. They show the opening, closing, high, and low prices of a currency pair for each period. Each bar represents one period, which can be a day, week, or month. The top of the bar represents the highest price, the bottom represents the lowest price, the left side of the bar represents the opening price, and the right side represents the closing price.
Candlestick charts are similar to bar charts, but they are more visually appealing and easier to read. Each candlestick represents one period, and it shows the opening, closing, high, and low prices of a currency pair. The body of the candlestick represents the opening and closing prices, while the wicks or shadows represent the high and low prices.
Interpreting Forex Charts
Forex charts provide valuable information that can help traders make informed decisions. The first thing to look at when interpreting a forex chart is the trend. A trend is the direction in which the price of a currency pair is moving over time. There are three types of trends – uptrend, downtrend, and sideways trend.
An uptrend is characterized by higher highs and higher lows, while a downtrend is characterized by lower highs and lower lows. A sideways trend is characterized by a range-bound market with no clear direction. Traders can use trend lines to identify trends and make trading decisions.
Another important aspect of forex charts is support and resistance levels. Support levels are prices at which buyers are likely to enter the market, while resistance levels are prices at which sellers are likely to enter the market. Traders can use these levels to identify potential entry and exit points.
In addition to trends and support and resistance levels, traders can also use technical indicators to analyze forex charts. Technical indicators are mathematical calculations that are based on the price and/or volume of a currency pair. Some popular technical indicators include moving averages, relative strength index (RSI), and stochastic oscillator.
Moving averages are used to smooth out price fluctuations and identify trends. RSI and stochastic oscillator are used to identify overbought and oversold conditions in the market. Traders can use these indicators to confirm trends and make trading decisions.
Conclusion
Forex charts are essential tools for forex traders. They provide valuable information that can help traders make informed decisions. To read forex charts effectively, traders must understand the basics of forex charts, such as the different types of charts and how to interpret them. They must also understand the importance of trends, support and resistance levels, and technical indicators. With this knowledge, traders can analyze forex charts and make profitable trades.


