The forex market is an ever-changing world, and to stay ahead of the curve, traders need to use every tool available to them. One such tool is news with charts. Combining these two elements can help traders make more informed decisions, improve their accuracy, and ultimately increase their profits. In this article, we will explore how to use news with charts in forex trading.

News and Charts
News refers to any information that affects the forex market. This includes economic data releases, political events, natural disasters, and any other event that might impact currency values. Charts, on the other hand, are graphical representations of currency values over time. They are used to identify trends, patterns, and potential trading opportunities.
Combining news and charts is a powerful tool for traders. By analyzing news events and their impact on currency values, traders can make more informed decisions about which trades to make. Charts can help traders identify trends and patterns that might not be immediately apparent from the news alone. When used together, news and charts can provide a more complete picture of the forex market and help traders make better-informed decisions.
Step 1: Stay Informed
The first step in using news with charts is to stay informed about the latest news events. This means keeping up with economic data releases, political events, and any other news that might impact currency values. There are many resources available for staying informed, including financial news websites, social media, and economic calendars.
Once you have identified the news events that are relevant to your trading strategy, you can begin to analyze their potential impact on currency values. This is where charts come in.
Step 2: Analyze the Charts
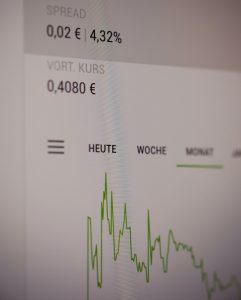
The next step is to analyze the charts to identify trends and patterns. There are many different types of charts available, including line charts, bar charts, and candlestick charts. Each type of chart has its own strengths and weaknesses, and traders should choose the one that best suits their needs.
Line charts are the simplest type of chart, showing the price of a currency pair over time as a line. Bar charts show the opening and closing prices, as well as the highs and lows, of a currency pair over a specific period. Candlestick charts are similar to bar charts but provide more detail about price movements.
Once you have chosen the type of chart you want to use, you can begin to analyze it for trends and patterns. Look for support and resistance levels, trend lines, and other indicators that might suggest a potential trading opportunity.
Step 3: Combine News and Charts
The final step is to combine the news and charts to make informed trading decisions. For example, if you are expecting a positive economic data release for a particular currency, you might look for an uptrend in the chart for that currency pair. This would suggest that investors are already bullish on the currency and that a positive data release could push the price even higher.
Alternatively, if you are expecting a negative news event, you might look for a downtrend in the chart for that currency pair. This would suggest that investors are already bearish on the currency and that the negative news could push the price even lower.
Conclusion
In conclusion, using news with charts in forex trading is a powerful tool for traders. By staying informed about the latest news events and analyzing the charts for trends and patterns, traders can make more informed decisions about which trades to make. When used together, news and charts provide a more complete picture of the forex market and can help traders improve their accuracy and increase their profits.