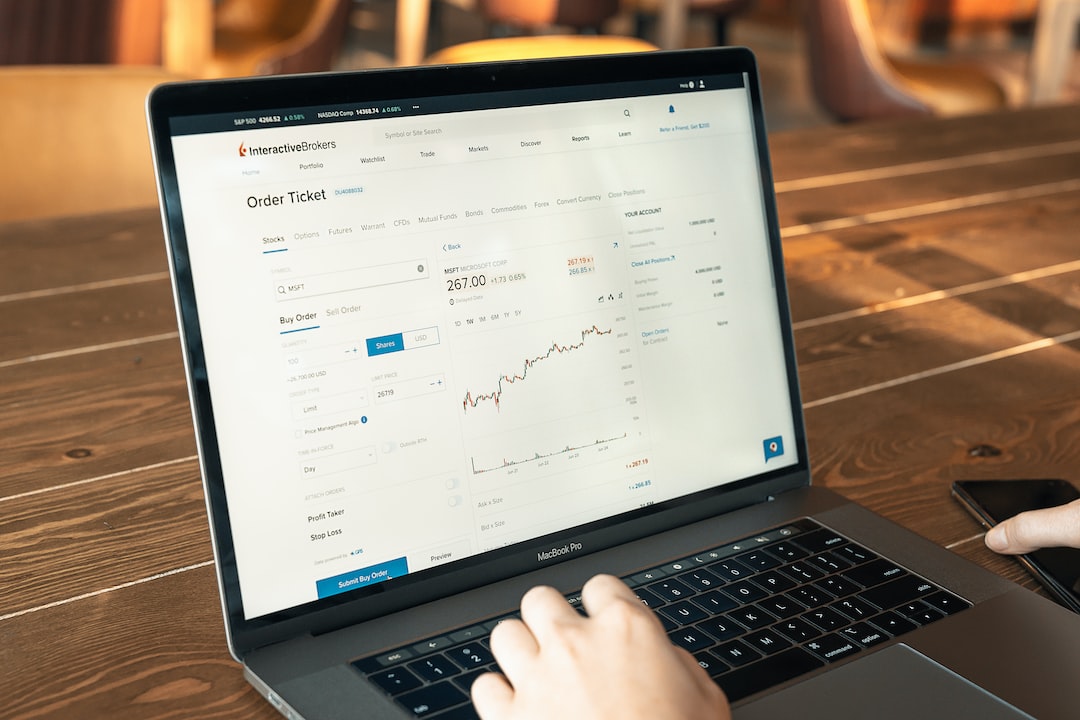
Forex trading has become increasingly popular over the years, thanks to the advent of the internet and the availability of powerful trading tools. One of the most important tools in forex trading is the forex chart. A forex chart is a visual representation of the price movement of a currency pair over a specified period.
In order to become a successful forex trader, it is important to understand how to read forex charts. In this article, we will provide an in-depth guide on how to read forex charts.
Types of Forex Charts
There are three main types of forex charts that traders use. These are:
1. Line Charts
Line charts are the simplest type of forex charts. They show the closing prices of a currency pair over a specified period in the form of a line. Line charts do not show the highs and lows of the currency pair during the specified period, making them less useful for technical analysis.
2. Bar Charts
Bar charts are more complex than line charts. They show the opening and closing prices of a currency pair during a specified period as well as the highs and lows of the currency pair during the same period. Bar charts are useful for technical analysis because they provide more information than line charts.
3. Candlestick Charts
Candlestick charts are the most popular type of forex charts. They show the opening and closing prices of a currency pair during a specified period as well as the highs and lows of the currency pair during the same period. Candlestick charts are useful for technical analysis because they provide more information than bar charts. They also provide visual cues that make it easier for traders to identify trends and patterns.
How to Read Forex Charts
1. Determine the Timeframe
The first step in reading a forex chart is to determine the timeframe you want to analyze. Forex charts can be viewed in various timeframes, ranging from one minute to one month. The timeframe you choose will depend on your trading style and strategy.
2. Identify the Currency Pair
The next step is to identify the currency pair you want to analyze. Forex charts display the price movement of currency pairs, such as EUR/USD, USD/JPY, GBP/USD, etc.
3. Analyze the Price Movement
Once you have identified the currency pair and timeframe, you can start analyzing the price movement. If you are using a candlestick chart, each candlestick represents a specified period, such as one minute, five minutes, one hour, etc.
The body of each candlestick represents the opening and closing prices of the currency pair during the specified period. If the body is green or white, it means that the closing price was higher than the opening price. If the body is red or black, it means that the closing price was lower than the opening price.
The wicks or shadows of each candlestick represent the highs and lows of the currency pair during the specified period. The upper wick represents the high and the lower wick represents the low.
4. Identify Trends and Patterns
Once you have analyzed the price movement, you can start identifying trends and patterns. Trends can be either upward or downward. An upward trend is characterized by a series of higher highs and higher lows. A downward trend is characterized by a series of lower highs and lower lows.
Patterns are formed when the price movement creates a recognizable shape, such as a head and shoulders pattern, a double top pattern, a double bottom pattern, etc. These patterns can indicate a potential trend reversal or continuation.
5. Use Technical Indicators
In addition to analyzing the price movement and identifying trends and patterns, traders can also use technical indicators to help them make trading decisions. Technical indicators are mathematical calculations based on the price and/or volume of a currency pair. They can help traders identify potential entry and exit points.
Some popular technical indicators include moving averages, relative strength index (RSI), stochastic oscillator, and Bollinger Bands.
Conclusion
Reading forex charts is an essential skill for any forex trader. By understanding how to read forex charts, traders can identify trends and patterns, and make informed trading decisions. Remember that forex trading involves a high degree of risk and traders should always practice proper risk management.


