Forex trading is a lucrative market that promises high returns for those who know how to navigate it. One of the key skills you need to learn is how to read the charts. Forex charts provide vital information about the price movements of currencies, and if you can interpret them correctly, you can make informed decisions that will help you succeed in the market.
In this article, we’ll take a detailed look at how to read the charts in forex.
Types of Forex Charts
Before we dive into how to read forex charts, it’s important to understand the different types of charts available. The three most common types of forex charts are:
1. Line Charts
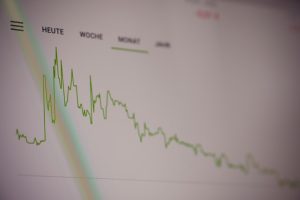
Line charts are the simplest type of forex chart. They show a line connecting the closing prices of a currency pair over a period of time. Line charts are useful for identifying trends in the market, but they don’t provide as much information as other types of charts.
2. Bar Charts
Bar charts are more complex than line charts and provide more information. They show the opening and closing prices of a currency pair over a period of time, as well as the highest and lowest prices during that period. Bar charts are useful for identifying trends, but they require some skill to read and interpret.
3. Candlestick Charts
Candlestick charts are the most popular type of forex chart. They show the opening and closing prices of a currency pair over a period of time, as well as the highest and lowest prices during that period. Candlestick charts are useful for identifying trends and patterns in the market, and they provide more information than line or bar charts.
How to Read Forex Charts
Now that you understand the different types of forex charts, let’s look at how to read them. Here are the steps you need to follow:
Step 1: Choose a Timeframe
The first step in reading a forex chart is to choose a timeframe. Forex charts can be viewed in different timeframes, ranging from one minute to one month. The timeframe you choose will depend on your trading strategy and the amount of time you have available to analyze the market.
Step 2: Identify the Currency Pair
The next step is to identify the currency pair you want to analyze. Forex charts can show the price movements of different currency pairs, so it’s important to choose the right one.
Step 3: Analyze the Price Movement
Once you’ve chosen a timeframe and currency pair, you can start analyzing the price movement on the chart. Look for patterns and trends that can help you predict future price movements.
Step 4: Use Technical Indicators
Technical indicators are tools that can help you analyze the price movement on a forex chart. They can help you identify trends, support and resistance levels, and other important information. Some of the most common technical indicators include moving averages, Bollinger Bands, and Relative Strength Index (RSI).
Step 5: Make Informed Decisions
Once you’ve analyzed the price movement and used technical indicators, you can make informed decisions about when to buy or sell a currency pair. Remember to always consider your risk management strategy and set stop-loss orders to minimize your losses.
Conclusion
Reading forex charts is an essential skill for anyone who wants to succeed in the forex market. By understanding the different types of charts and following the steps outlined in this article, you can learn how to analyze price movements and make informed decisions. Remember to always keep your risk management strategy in mind and never trade more than you can afford to lose.


