Forex trading is a popular way of making money online. It involves buying and selling currencies in order to make a profit. One of the most important tools used in forex trading is the candlestick chart. In this article, we will explain what a candlestick chart is and how to read it.
What is a candlestick chart?
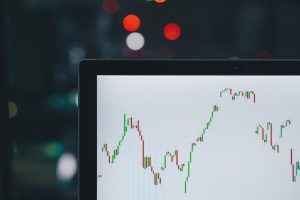
A candlestick chart is a type of chart used to represent the movement of a currency pair. It is made up of individual candles, each representing a specific period of time. The candles are made up of a body and two wicks, one at the top and one at the bottom. The body represents the opening and closing prices for the period, while the wicks represent the highest and lowest prices reached during that period.
How to read a candlestick chart?
The first thing you need to do when reading a candlestick chart is to identify the time frame that you are interested in. This could be anything from a minute to a month. Once you have identified the time frame, you can start reading the chart.
The first thing you need to look at is the color of the candle. If the candle is green, it means that the closing price was higher than the opening price. If the candle is red, it means that the closing price was lower than the opening price.
Next, you need to look at the length of the body of the candle. If the body is long, it means that there was a lot of movement in the price during that period. If the body is short, it means that there was not much movement in the price during that period.
You also need to look at the wicks. If the wick at the top is long, it means that the price reached a high level during that period but then fell back down. If the wick at the bottom is long, it means that the price reached a low level during that period but then rose back up.
What can you learn from a candlestick chart?
A candlestick chart can tell you a lot about the movement of a currency pair. For example, if you see a long green candle, it means that there was a lot of buying activity during that period. This could be a sign that the price is going to continue to rise.
On the other hand, if you see a long red candle, it means that there was a lot of selling activity during that period. This could be a sign that the price is going to continue to fall.
You can also look for patterns in the candlestick chart. For example, if you see a series of green candles followed by a red candle, it could be a sign that the price is about to start falling. This is known as a bearish reversal pattern.
Conclusion
A candlestick chart is an important tool for forex traders. It can tell you a lot about the movement of a currency pair and help you make informed trading decisions. By understanding how to read a candlestick chart, you can improve your chances of making a profit in the forex market.