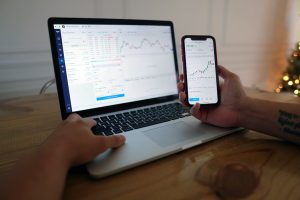
Forex, also known as foreign exchange or currency trading, is the process of buying and selling currencies with the aim of making a profit. The forex market is the largest financial market in the world, with trillions of dollars being traded every day. It is a global market where currencies are traded 24 hours a day, five days a week.
If you are new to forex trading, understanding how to read the forex market can be overwhelming. However, with the right knowledge and tools, it can be a profitable venture. In this article, we will explain how to read forex and provide you with some tips on trading successfully.
Understanding Forex Quotes
The first step in reading forex is to understand forex quotes. Forex quotes are the exchange rates between two currencies. The quote is always in the form of a currency pair, with the base currency being the first currency and the quote currency being the second currency. For example, the USD/EUR currency pair represents the exchange rate between the US dollar and the Euro.
Forex quotes are always displayed in two prices: the bid price and the ask price. The bid price is the price at which you can sell the base currency, while the ask price is the price at which you can buy the base currency. The difference between the bid and ask price is known as the spread.
Charts and Technical Analysis
Forex charts are graphical representations of price movements. They are used to analyze the market and identify trading opportunities. Forex charts can be displayed in different timeframes, such as minutes, hours, days, or weeks. The most commonly used charts in forex trading are candlestick charts.
Technical analysis is the process of analyzing forex charts to identify patterns, trends, and trading opportunities. There are different technical indicators that traders use to analyze the market, such as moving averages, trend lines, and momentum indicators.
One of the most popular technical indicators is the Relative Strength Index (RSI). The RSI is a momentum indicator that compares the magnitude of recent gains to recent losses in an attempt to determine overbought and oversold conditions of an asset.
Fundamental Analysis
Fundamental analysis is the process of analyzing economic, financial, and other qualitative and quantitative factors that affect the value of currencies. For example, economic indicators such as Gross Domestic Product (GDP), inflation rates, and interest rates can affect the value of a currency.
Traders who use fundamental analysis to trade forex often use news releases and economic calendars to stay up-to-date on economic events that could affect the market. Economic calendars provide traders with a schedule of upcoming economic releases, such as GDP, employment reports, and central bank announcements.
Risk Management
Risk management is an essential part of forex trading. It involves managing your trading risk by using stop-loss orders, position sizing, and risk-reward ratios. Stop-loss orders are used to limit your losses in case the market moves against your position. Position sizing is the process of determining the size of your trades based on your account balance and risk tolerance. Risk-reward ratios are used to determine the potential profit and loss of a trade.
Conclusion
Forex trading can be a profitable venture if you understand how to read forex charts and use technical and fundamental analysis to identify trading opportunities. To be successful, you need to have a good understanding of forex quotes, charts, technical and fundamental analysis, and risk management. It is also important to stay up-to-date on economic events and news releases that could affect the market. With the right knowledge and tools, you can become a successful forex trader.


