How to Read Forex Free Charts: A Beginner’s Guide
For those interested in trading forex, understanding how to read forex charts is essential. Forex charts provide traders with valuable information about currency price movements and trends, enabling them to make informed trading decisions. In this beginner’s guide, we will explore the basics of reading forex charts and provide you with the necessary knowledge to get started in the exciting world of forex trading.
Types of Forex Charts
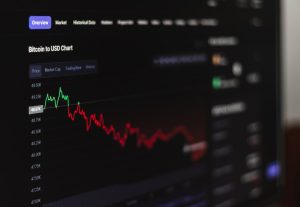
There are several types of forex charts available, but the most commonly used ones are line charts, bar charts, and candlestick charts. Each chart type has its advantages and can be used to analyze different aspects of currency price movements.
1. Line Charts: Line charts are the simplest form of forex charts. They depict the closing prices of a currency pair over a specific period. By connecting the closing prices with a line, line charts provide a visual representation of the overall trend of a currency pair.
2. Bar Charts: Bar charts provide more detailed information compared to line charts. They display the opening, closing, high, and low prices of a currency pair within a specific time frame. The vertical line represents the range between the high and low prices, while the horizontal lines on the left and right sides indicate the opening and closing prices, respectively.
3. Candlestick Charts: Candlestick charts are widely used by forex traders due to their ability to provide comprehensive information about price movements. Each candlestick represents a specific time period and consists of a body and wicks. The body represents the opening and closing prices, while the wicks indicate the high and low prices. Candlestick charts are visually appealing and can be easily interpreted, making them popular among traders.
Reading Forex Charts
Now that we have covered the different types of forex charts, let’s dive into how to read them effectively.
1. Identify the Time Frame: Before analyzing a forex chart, it is crucial to determine the time frame you want to focus on. Forex charts can be viewed in various time frames, such as minutes, hours, days, or even months. Different time frames provide different levels of detail and are suitable for different trading strategies. Shorter time frames are ideal for day traders, while longer time frames are preferred by swing traders and long-term investors.
2. Analyze the Trend: The trend is a fundamental concept in forex trading. It refers to the general direction in which a currency pair is moving. To identify the trend, look for higher highs and higher lows in an uptrend, or lower highs and lower lows in a downtrend. Utilizing trend lines can help visualize and confirm the direction of the trend.
3. Use Support and Resistance Levels: Support and resistance levels are areas on a forex chart where the price tends to stop or reverse. Support levels are below the current price, while resistance levels are above it. Traders often use these levels to identify potential entry and exit points. When the price approaches a support level, it may bounce back up, indicating a buying opportunity. On the other hand, when the price nears a resistance level, it may reverse downwards, suggesting a selling opportunity.
4. Consider Indicators: Forex charts can be enhanced with the use of technical indicators. These indicators are mathematical calculations based on historical price data and can help traders identify potential market trends and reversals. Some popular indicators include moving averages, relative strength index (RSI), and stochastic oscillator. It is important to note that indicators should be used in conjunction with other analysis techniques for accurate predictions.
5. Practice and Learn: Reading forex charts is a skill that improves with practice and experience. Start by analyzing historical data and comparing it with the actual market movements. Observe how different chart patterns and indicators align with price movements. Additionally, many forex brokers offer demo accounts that allow you to practice trading with virtual money in real market conditions. Utilize these resources to gain hands-on experience and develop your chart reading skills.
In conclusion, learning how to read forex charts is an essential skill for anyone interested in trading forex. By understanding the different types of charts, analyzing trends, identifying support and resistance levels, utilizing technical indicators, and practicing regularly, you can develop the necessary expertise to make informed trading decisions. Remember, like any skill, it takes time and effort to become proficient in reading forex charts, so be patient and persistent in your learning journey.


