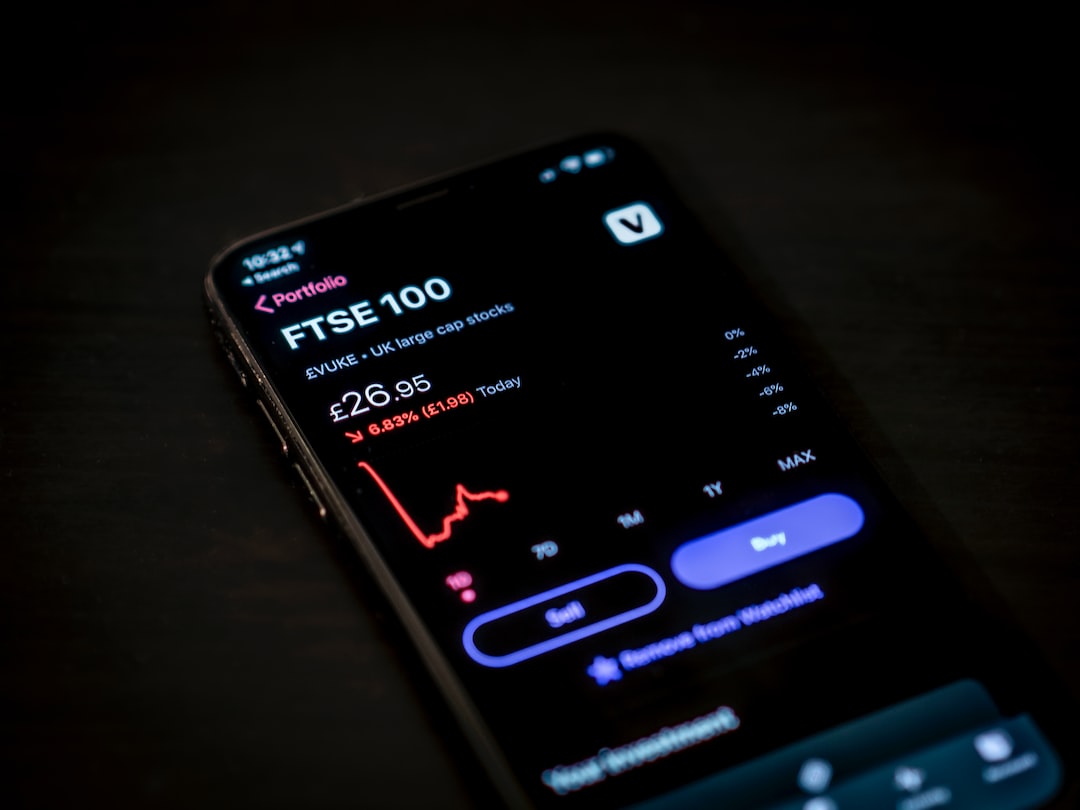
Forex charts are graphical representations of the movements and fluctuations of currency prices over time. The charts are a crucial tool for traders to analyze, predict, and make informed decisions in the foreign exchange market. Forex charts pdf provides a convenient way to access, read, and interpret forex charts. In this article, we will explore how to read forex charts pdf.
Types of forex charts
There are three main types of forex charts: line charts, bar charts, and candlestick charts. Each chart has its unique features and provides different types of information.
Line Charts: A line chart is the simplest type of forex chart. It shows the closing prices of a currency pair over a given period. The line chart is easy to read and provides a quick overview of the price trend. However, it does not provide detailed information about price movements during the day.
Bar Charts: A bar chart provides more detailed information than a line chart. It shows the opening, closing, high, and low prices of a currency pair over a given period. The vertical line represents the range between the high and low prices, while the horizontal lines represent the opening and closing prices.
Candlestick Charts: A candlestick chart is the most popular type of forex chart. It provides the same information as a bar chart but in a more visual and intuitive way. A candlestick chart uses candlesticks to represent the opening, closing, high, and low prices of a currency pair over a given period. A green or white candlestick represents a bullish move, while a red or black candlestick represents a bearish move.
Reading forex charts
Forex charts pdf provide traders with a wide range of information that they can use to make informed decisions. Here are some key elements of forex charts that traders should pay attention to:
Timeframe: The timeframe on the chart represents the period over which the prices are plotted. Traders can choose different timeframes, ranging from one minute to several months or years.
Price Axis: The price axis represents the price level of the currency pair. The vertical axis shows the price levels, and the horizontal axis shows the timeframe.
Trendlines: Trendlines are a useful tool for identifying trends in the market. Traders draw trendlines by connecting the higher lows in an uptrend or the lower highs in a downtrend.
Indicators: Indicators are tools that traders use to analyze the market. They provide additional information about the price movements, such as moving averages, relative strength index, and stochastic oscillator.
Support and Resistance Levels: Support and resistance levels are key levels on the chart where the price tends to bounce off or break through. Traders use these levels to identify potential entry and exit points.
Conclusion
Forex charts pdf provide traders with a convenient way to access, read, and interpret forex charts. Understanding how to read forex charts is essential for making informed trading decisions. By paying attention to key elements such as the timeframe, price axis, trendlines, indicators, and support and resistance levels, traders can gain a deeper understanding of the market and make more accurate predictions. Whether you are a beginner or an experienced trader, mastering the art of reading forex charts is crucial for success in the foreign exchange market.


