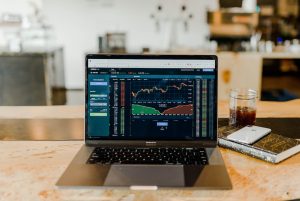
Candlestick charts are an essential tool for forex traders. They are used to analyze price movements and identify trends in the market. The candlestick chart is made up of individual candles, each of which shows the price movement of a currency pair over a specific period of time. In this article, we will explain how to read candlesticks forex and how they can be used to make trading decisions.
What are Candlesticks?
Candlesticks are graphical representations of price movements in the forex market. They are made up of a rectangular body and two thin lines, called shadows or wicks, above and below the body. The body represents the opening and closing prices of a currency pair, while the shadows show the high and low prices during the specified period.
How to Read Candlesticks Forex?
The main advantage of candlestick charts is that they provide a visual representation of price movements that is easy to interpret. Here are the steps you can follow to read candlesticks forex:
1. Identify the Timeframe
The first step in reading a candlestick chart is to identify the timeframe you want to analyze. Candlestick charts can be created for any timeframe, from 1 minute to 1 month. The most commonly used timeframes are 15 minutes, 1 hour, 4 hours, and daily.
2. Analyze the Candlestick
Once you have identified the timeframe, you can start analyzing the candlesticks. Each candlestick represents a specific period of time, such as 15 minutes or 1 hour. The color of the candlestick indicates whether the price went up or down during that period. A green or white candlestick indicates that the price went up, while a red or black candlestick indicates that the price went down.
The body of the candlestick represents the opening and closing prices of the currency pair. If the body is long, it indicates a significant price movement during the period. If the body is short, it indicates a minor price movement.
The shadows or wicks above and below the body represent the high and low prices during the period. If the shadow is long, it indicates that the price reached a high or low during the period but eventually closed near the opening price.
3. Interpret the Candlestick
Once you have analyzed the candlestick, you can interpret it to identify trends and make trading decisions. Here are some common candlestick patterns and their meanings:
a. Bullish Engulfing Pattern
A bullish engulfing pattern occurs when a small red candlestick is followed by a larger green or white candlestick. It indicates that the buyers have taken control of the market, and the price is likely to go up.
b. Bearish Engulfing Pattern
A bearish engulfing pattern occurs when a small green or white candlestick is followed by a larger red or black candlestick. It indicates that the sellers have taken control of the market, and the price is likely to go down.
c. Doji Candlestick
A doji candlestick occurs when the opening and closing prices are the same, and the body is very small. It indicates that the market is indecisive, and the price could go either way.
d. Hammer Candlestick
A hammer candlestick occurs when the body is small, and the shadow below the body is long. It indicates that the sellers have taken control of the market, but the buyers have pushed the price back up, and the price is likely to go up.
e. Shooting Star Candlestick
A shooting star candlestick occurs when the body is small, and the shadow above the body is long. It indicates that the buyers have taken control of the market, but the sellers have pushed the price back down, and the price is likely to go down.
Conclusion:
In conclusion, candlestick charts are an essential tool for forex traders. They provide a visual representation of price movements that is easy to interpret. By analyzing candlesticks, traders can identify trends and make trading decisions. Reading candlesticks forex requires understanding the different components of a candlestick, such as the body and shadows, and interpreting common candlestick patterns, such as the bullish engulfing pattern and the doji candlestick. With practice, anyone can become proficient in reading candlestick charts and using them to make profitable trades.