Forex charts are an important tool for traders to analyze the market and make informed trading decisions. A forex chart is a graphical representation of the price movements of a currency pair over a period of time. The chart displays the currency pair’s exchange rate on the vertical y-axis and the time period on the horizontal x-axis. There are various types of forex charts, including line charts, bar charts, and candlestick charts. In this article, we will discuss how to look at forex charts and interpret them.

1. Understand the Timeframe
The first step in looking at forex charts is to understand the timeframe. Forex charts can be viewed in different timeframes, including daily, weekly, monthly, and even intraday. Each timeframe provides a different perspective on the market. For instance, a daily chart shows the price movements of a currency pair over a day, while a weekly chart shows the price movements over a week. The timeframe you choose will depend on your trading style and strategy.
2. Identify the Currency Pair
The next step is to identify the currency pair you want to analyze. Forex charts display the exchange rate of two currencies, such as the EUR/USD, GBP/USD, or USD/JPY. Each currency pair has its unique price movements based on various economic, political, and social factors.
3. Choose the Chart Type
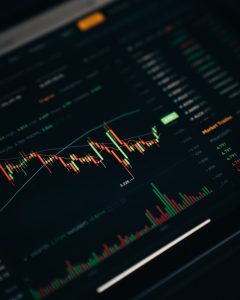
Forex charts can be displayed in different types, including line charts, bar charts, and candlestick charts. Each chart type provides different information on the price movements of a currency pair. A line chart shows the closing prices of a currency pair over a period of time, while a bar chart shows the opening, closing, high, and low prices of a currency pair. A candlestick chart displays the same information as a bar chart but in a visual format that is easy to read.
4. Analyze the Trend
The trend is an essential aspect of forex trading. It refers to the direction of the price movements of a currency pair over a period of time. A trend can be bullish (upward), bearish (downward), or sideways (flat). To analyze the trend, traders can use trend lines, moving averages, or other technical indicators.
5. Use Technical Indicators
Technical indicators are mathematical calculations based on the price and volume data of a currency pair. They help traders identify trends, support and resistance levels, and potential trading opportunities. Some commonly used technical indicators include moving averages, relative strength index (RSI), stochastic oscillator, and Bollinger bands.
6. Identify Support and Resistance Levels
Support and resistance levels are points on a forex chart where the price of a currency pair tends to bounce off. Support levels are below the current price, while resistance levels are above the current price. Traders can use support and resistance levels to identify potential entry and exit points.
7. Monitor Economic Events
Economic events can have a significant impact on the forex market. Traders should keep an eye on economic indicators such as GDP, inflation, interest rates, and employment data. These indicators provide insights into the strength of an economy and can influence the exchange rate of a currency pair.
Conclusion
Forex charts are a crucial tool for traders to analyze the market and make informed trading decisions. Traders should understand the timeframe, identify the currency pair, choose the chart type, analyze the trend, use technical indicators, identify support and resistance levels, and monitor economic events. By following these steps, traders can gain a better understanding of the market and develop effective trading strategies.