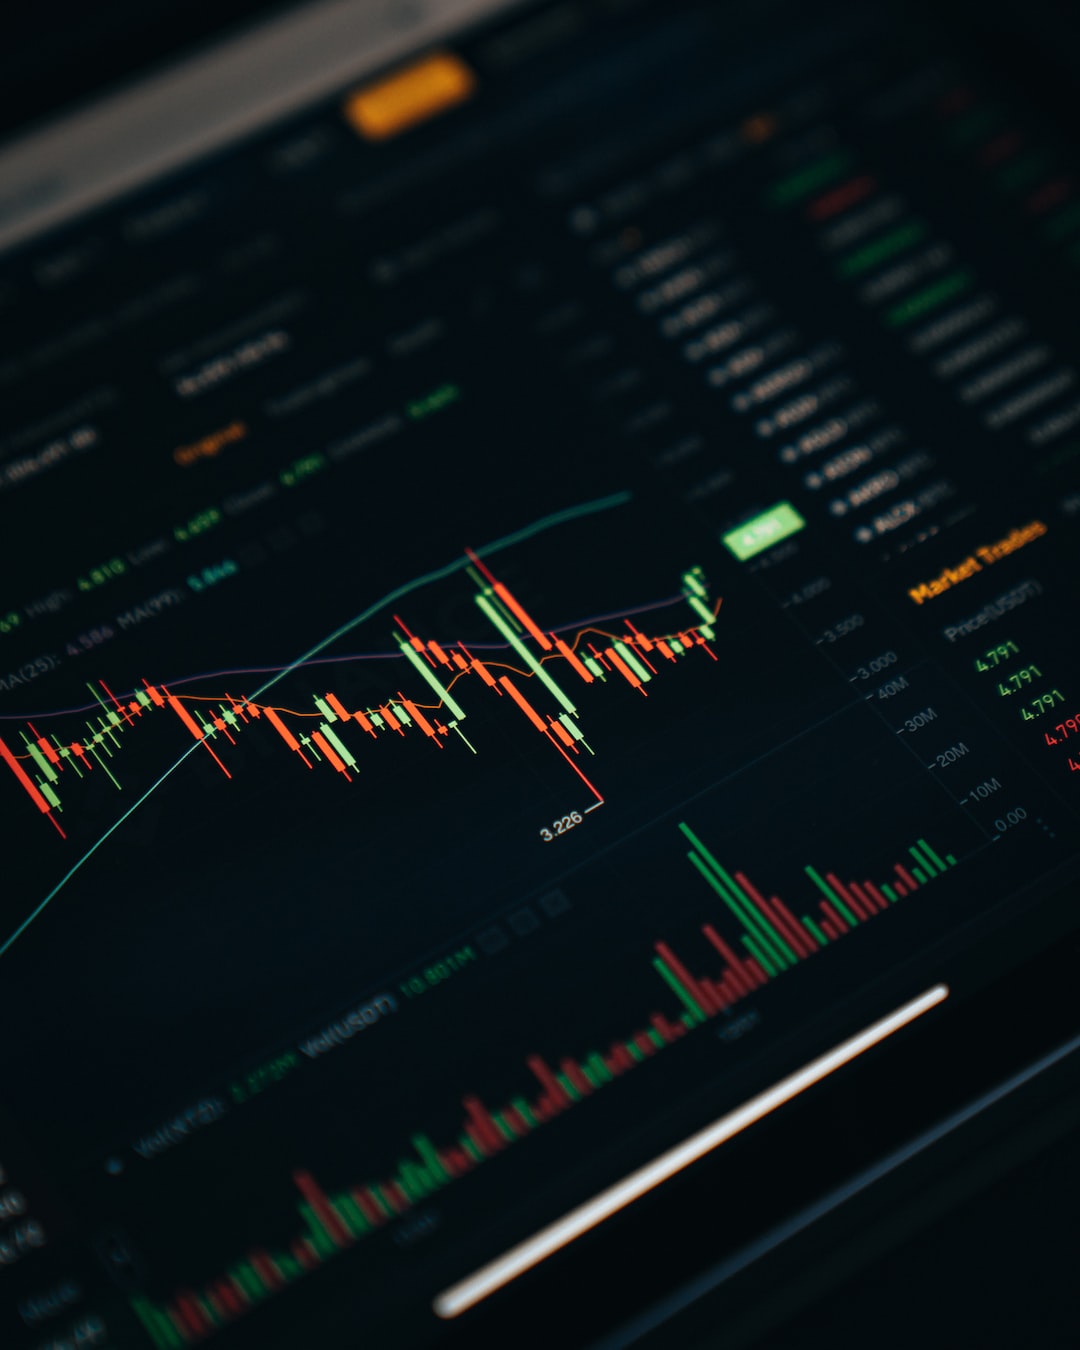
Technical analysis is a method of evaluating financial instruments by analyzing past market data, primarily price and volume, to predict future price movements. In forex trading, technical analysis is a crucial tool that traders use to make informed decisions about buying and selling currencies.
Here are the steps to doing technical analysis in forex:
Step 1: Choose a technical analysis method
There are several technical analysis methods that traders use in forex trading. Some of the most popular ones include:
– Candlestick patterns: This method involves analyzing the shapes and patterns of candlesticks to identify potential price movements.
– Moving averages: This method involves calculating the average price of a currency pair over a specific period of time to identify trends.
– Support and resistance levels: This method involves identifying key price levels where the market has previously struggled to move beyond, which could indicate potential buying or selling opportunities.
– Fibonacci retracements: This method involves using Fibonacci ratios to identify potential areas of support and resistance.
Traders may use one or a combination of these methods depending on their trading style and the market conditions.
Step 2: Identify the trend
The first step to doing technical analysis in forex is to identify the trend. A trend is the general direction that the market is moving in, either up (bullish) or down (bearish).
Traders can identify the trend by looking at the price charts and identifying higher highs and higher lows for an uptrend or lower highs and lower lows for a downtrend. Once the trend is identified, traders can then use technical analysis methods to identify potential entry and exit points.
Step 3: Analyze price patterns
After identifying the trend, traders can then start analyzing price patterns using their chosen technical analysis method. For example, if using candlestick patterns, traders will look for specific shapes and patterns that indicate potential price movements.
If using moving averages, traders will look for crossovers between different moving averages to identify potential buy or sell signals. If using support and resistance levels, traders will look for price levels where the market has previously struggled to move beyond, which could indicate potential buying or selling opportunities.
Step 4: Use indicators
Technical analysis indicators are mathematical calculations that traders use to identify potential price movements. There are many different indicators that traders can use, such as the Relative Strength Index (RSI), Moving Average Convergence Divergence (MACD), and the Stochastic Oscillator.
Traders can use these indicators to confirm their analysis and identify potential entry and exit points. For example, if the RSI indicator shows that a currency pair is oversold, it could indicate a potential buying opportunity.
Step 5: Monitor the news
While technical analysis is an important tool in forex trading, it’s also important to keep an eye on the news and economic data releases that could impact the market. Traders should be aware of key events like central bank meetings, economic data releases, and geopolitical events that could affect currency prices.
By combining technical analysis with fundamental analysis, traders can make more informed trading decisions and reduce their risk exposure.
In conclusion, technical analysis is an essential tool for forex traders to analyze past market data and predict future price movements. By choosing a technical analysis method, identifying the trend, analyzing price patterns, using indicators, and monitoring the news, traders can make informed trading decisions and increase their chances of success in the forex market.


