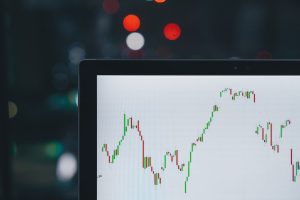
The foreign exchange market, or forex market, is a highly volatile and fast-paced market where traders buy and sell currencies. To trade successfully in forex, traders need to use various tools and indicators to analyze the price movements of currency pairs. One such tool is the deviation level, which helps traders to identify potential price movements and make better trading decisions. In this article, we will discuss in-depth how to add deviation levels in forex charts.
What are Deviation Levels?
Deviation levels are a technical analysis tool that is used to measure the variation between an asset’s current price and its average price over a specified period. In forex trading, deviation levels are typically used to identify potential price movements and to set stop losses and take profit levels.
Deviation levels are calculated using the standard deviation formula, which measures the dispersion of data around its mean. The standard deviation formula calculates the square root of the variance, which is the average of the squared differences between each data point and the mean.
To add deviation levels to a forex chart, traders can use various charting tools, including MetaTrader 4 (MT4), TradingView, and other charting software.
How to Add Deviation Levels in MT4?
MT4 is a popular trading platform used by forex traders worldwide. Adding deviation levels in MT4 is a straightforward process that involves the following steps:
Step 1: Open the MT4 platform and select the currency pair that you want to trade.
Step 2: Click on the ‘Insert’ tab in the top menu bar and select ‘Indicators.’
Step 3: From the list of indicators, select ‘Bollinger Bands’ and click on ‘Apply.’
Step 4: Once the Bollinger Bands are added to your chart, you can adjust the deviation levels by clicking on the ‘Properties’ tab in the top menu bar.
Step 5: In the ‘Properties’ tab, you can adjust the number of standard deviations used to calculate the upper and lower bands. The default setting is two standard deviations, but you can adjust this to suit your trading strategy.
Step 6: Once you have adjusted the deviation levels, you can use the Bollinger Bands as a tool for identifying potential price movements, setting stop losses and take profit levels, and determining the overall market trend.
How to Add Deviation Levels in TradingView?
TradingView is a popular charting software used by forex traders and other financial market participants. Adding deviation levels in TradingView is a simple process that involves the following steps:
Step 1: Open TradingView and select the currency pair that you want to trade.
Step 2: Click on the ‘Indicators’ button in the top menu bar and select ‘Bollinger Bands’ from the list of indicators.
Step 3: Once the Bollinger Bands are added to your chart, you can adjust the deviation levels by clicking on the ‘Settings’ icon next to the indicator.
Step 4: In the ‘Settings’ window, you can adjust the number of standard deviations used to calculate the upper and lower bands. You can also adjust the color, style, and width of the bands to suit your preferences.
Step 5: Once you have adjusted the deviation levels, you can use the Bollinger Bands as a tool for identifying potential price movements, setting stop losses and take profit levels, and determining the overall market trend.
Conclusion
Adding deviation levels to forex charts is a simple process that can help traders to identify potential price movements, set stop losses and take profit levels, and determine the overall market trend. Deviation levels are calculated using the standard deviation formula and can be added to forex charts using various charting tools, including MT4 and TradingView. By using deviation levels, traders can make better trading decisions and improve their chances of success in the highly competitive forex market.