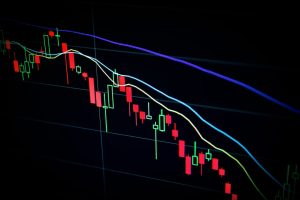
Banks are among the largest players in the forex market, and they employ various strategies to make profits from currency trading. One of the most common approaches used by banks is technical analysis, a method that involves analyzing past market data to identify trends and patterns that can help forecast future price movements. In this article, we will explore how banks trade forex using technical analysis.
What is Technical Analysis?
Technical analysis is a trading approach that relies on charts and other graphical representations of market data to identify patterns and trends in price movements. This method assumes that market trends, price patterns, and other technical indicators can help predict future price movements. Technical analysts use various tools and techniques such as moving averages, trend lines, and momentum indicators to analyze market data and make trading decisions.
How do Banks Use Technical Analysis in Forex Trading?
Banks use technical analysis in forex trading to identify profitable trading opportunities and manage risks. They employ sophisticated trading systems that incorporate various technical indicators and algorithms to analyze market data and make trading decisions. Here are some of the ways banks use technical analysis in forex trading:
1. Identifying Trends
Banks use technical analysis to identify trends in the forex market, which can help them predict future price movements. They use tools such as moving averages, trend lines, and chart patterns to identify the direction of the market trend. Once they identify a trend, they will use it to make trading decisions, such as entering or exiting a trade.
2. Analyzing Support and Resistance Levels
Banks also use technical analysis to analyze support and resistance levels in the forex market. Support levels are price levels where demand for a currency is strong enough to prevent it from falling further. Resistance levels, on the other hand, are price levels where supply for a currency is strong enough to prevent it from rising further. Banks use support and resistance levels to identify potential entry and exit points for their trades.
3. Using Moving Averages
Banks use moving averages, which are calculated by averaging the closing prices of a currency pair over a specific period, to identify trends and potential trading opportunities. They use different moving averages, such as the simple moving average (SMA) and the exponential moving average (EMA), to analyze market data and make trading decisions.
4. Analyzing Chart Patterns
Banks use chart patterns, such as head and shoulders, triangles, and double tops, to identify potential trading opportunities. Chart patterns are formed by price movements, and they can help predict future price movements. Banks use chart patterns to identify potential entry and exit points for their trades.
5. Using Momentum Indicators
Banks use momentum indicators, such as the relative strength index (RSI) and the stochastic oscillator, to identify potential trading opportunities. Momentum indicators measure the strength and speed of price movements and can help predict future price movements. Banks use momentum indicators to identify potential entry and exit points for their trades.
Conclusion
Banks use technical analysis in forex trading to identify profitable trading opportunities and manage risks. They employ sophisticated trading systems that incorporate various technical indicators and algorithms to analyze market data and make trading decisions. Technical analysis is a powerful tool that can help banks make informed trading decisions and increase their profits in the forex market.


