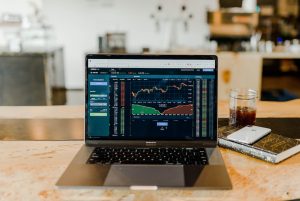
Forex trading is a dynamic activity that requires traders to make informed decisions based on various market trends and indicators. One of the most important tools in forex trading is the use of short-term charts to analyze market movements. These charts provide a wealth of information that can help traders make profitable trades. However, analyzing short-term forex charts can be challenging, especially for new traders. In this article, we will explore how best to analyze short-term forex charts.
Understand the Timeframe
The first step in analyzing short-term forex charts is to understand the timeframe of the chart. Short-term forex charts typically cover a period of 5 minutes to 1 hour. Understanding the timeframe of the chart is crucial because it helps traders to identify trends and patterns that are relevant to their trading strategy. For instance, if a trader is looking to make a quick profit, they may want to focus on 5-minute charts, while a trader who is looking for a longer-term investment may prefer 1-hour charts.
Identify Key Support and Resistance Levels
Support and resistance levels are key to understanding short-term forex charts. Support levels are price levels where the demand for a currency pair is strong enough to prevent the price from falling further. Resistance levels are price levels where the supply of a currency pair is strong enough to prevent the price from rising further. Identifying these levels is crucial because they can help traders to predict potential price movements in the market.
Use Technical Indicators
Technical indicators are mathematical calculations that are used to analyze short-term forex charts. These indicators can help traders to identify trends, momentum, and potential reversals in the market. Some of the most commonly used technical indicators in forex trading include moving averages, Bollinger Bands, and Relative Strength Index (RSI). It is important to note that technical indicators should not be used in isolation but should be combined with other analysis techniques to make informed trading decisions.
Pay Attention to News Events
News events can have a significant impact on short-term forex charts. Economic data releases, political events, and central bank announcements can all cause sudden price movements in the market. Traders should pay close attention to news events that are related to the currency pairs they are trading. They should also be prepared to adjust their trading strategy in response to unexpected news events.
Maintain a Trading Journal
Maintaining a trading journal is a useful tool for analyzing short-term forex charts. A trading journal can help traders to identify their strengths and weaknesses in trading. It can also help traders to track their progress and evaluate the effectiveness of their trading strategies. A trading journal can also be used to record important market events, including news releases and significant price movements.
Conclusion
Analyzing short-term forex charts can be challenging, but it is a crucial skill for any forex trader. By understanding the timeframe of the chart, identifying key support and resistance levels, using technical indicators, paying attention to news events, and maintaining a trading journal, traders can make informed trading decisions that can result in profitable trades. It is important for traders to remember that forex trading involves risk, and they should always use proper risk management techniques to protect their capital.


