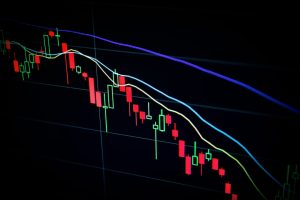
Forex, also known as foreign exchange or currency trading, is the largest financial market in the world. It involves trading currencies between individuals, banks, and other financial institutions. The goal of forex trading is to make a profit by buying a currency at a low price and selling it at a higher price. To be successful in forex trading, traders use various technical indicators to analyze market trends and make informed decisions about when to buy or sell currencies. One such technical indicator is ADX.
ADX, or Average Directional Index, is a technical indicator used by forex traders to determine the strength of a trend. The ADX is calculated by taking the difference between two moving averages, the positive directional movement indicator (+DMI) and the negative directional movement indicator (-DMI), and dividing it by the sum of the two indicators.
The ADX is displayed as a line that ranges from 0 to 100. A reading below 20 indicates a weak trend, while a reading above 50 indicates a strong trend. A reading between 20 and 50 indicates a moderate trend. Traders use the ADX to identify the strength of a trend and to determine whether to enter or exit a trade.
When the ADX is below 20, it indicates that the market is in a range-bound phase with no clear trend. In this situation, traders may choose to wait for a trend to develop before entering a trade. When the ADX is between 20 and 50, it indicates a moderate trend. Traders may choose to enter a trade during this phase if they believe the trend will continue. When the ADX is above 50, it indicates a strong trend. Traders may choose to enter a trade during this phase if they believe the trend will continue to gain momentum.
The ADX is also used to identify potential trend reversals. When the ADX is declining from a high level, it indicates that the trend is losing momentum and may be coming to an end. Traders may choose to exit a trade during this phase to lock in profits. When the ADX is rising from a low level, it indicates that a new trend may be developing. Traders may choose to enter a trade during this phase if they believe the new trend will continue.
In addition to the ADX, forex traders use other technical indicators to analyze market trends and make informed trading decisions. These indicators include moving averages, relative strength index (RSI), stochastic oscillator, and Bollinger Bands. Traders use a combination of these indicators to confirm trends and identify potential trading opportunities.
Forex traders should be aware that no technical indicator is foolproof. Traders should use multiple indicators and analysis techniques to confirm trends and make informed trading decisions. Additionally, traders should always use risk management techniques such as stop-loss orders to limit potential losses.
In conclusion, the Average Directional Index (ADX) is a technical indicator used by forex traders to determine the strength of a trend. The ADX is calculated by taking the difference between two moving averages, the positive directional movement indicator (+DMI) and the negative directional movement indicator (-DMI), and dividing it by the sum of the two indicators. The ADX ranges from 0 to 100, with a reading below 20 indicating a weak trend, a reading between 20 and 50 indicating a moderate trend, and a reading above 50 indicating a strong trend. Traders use the ADX to identify potential trading opportunities and to confirm trends. However, traders should always use multiple indicators and risk management techniques to make informed trading decisions.


